Climetry's climate data is checked against 7,053 weather stations worldwide.
Independent NOAA / Meteostat station observations, 2015-2024, on every populated continent — 338,544 monthly observed-versus-model comparisons. The ERA5-Land and CEY10 climate basis agrees with those stations to about 1.6 °C on temperature and 4.8 percentage points on relative humidity, with near-zero bias, and the residual scatter is explained by grid-cell-versus-point elevation, not model error.
What the comparison shows.
The climate basis is unbiased at scale
ERA5-Land monthly temperature, dew point, relative and absolute humidity match 7,053 independent stations with near-zero mean bias and R² ≥ 0.98 for the thermodynamic variables.
The representative year preserves the climate
CEY10 — Climetry's synthetic engineering year — tracks the reanalysis and the station climatology almost exactly: monthly-profile RMSE 1.3 °C for temperature, 0.6 g/m³ for absolute humidity.
The residual scatter is explained, not hidden
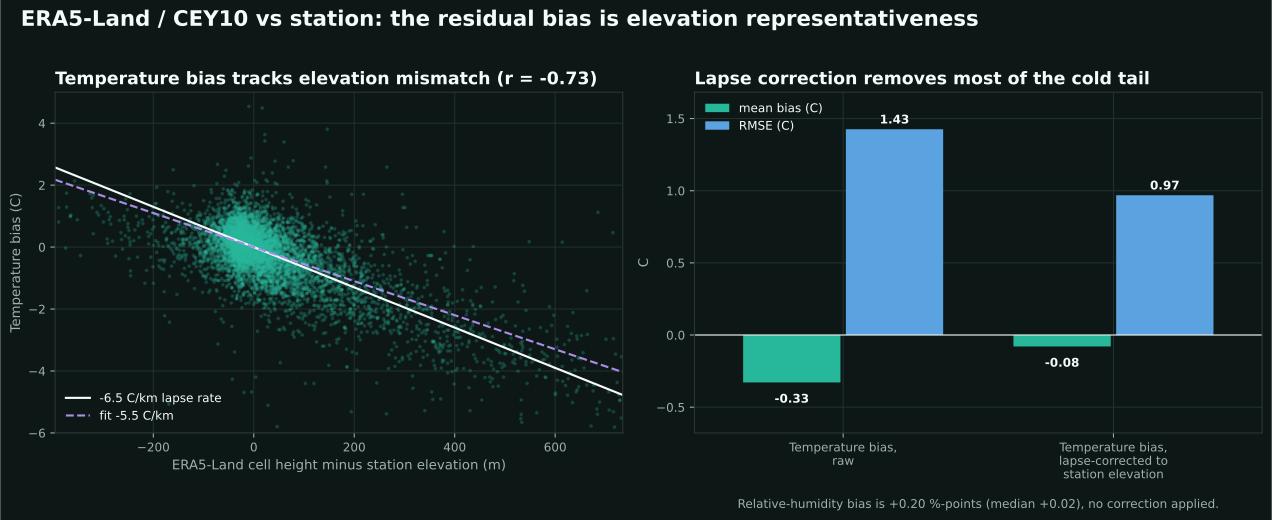
Most of the remaining ~1 °C spread is grid-cell-versus-point elevation representativeness, not model error — it correlates −0.73 with the model-cell-height / station-elevation difference and a lapse-rate correction removes it.
We validate the data basis, not the whole product
Corrosion rates, ISO corrosivity classes, chloride and sulfate deposition and product lifetime are separate validation chains, summarised in their own layer below.
Layer 0 — the numbers behind the headline
Inventory, then subset. They are not the same count.
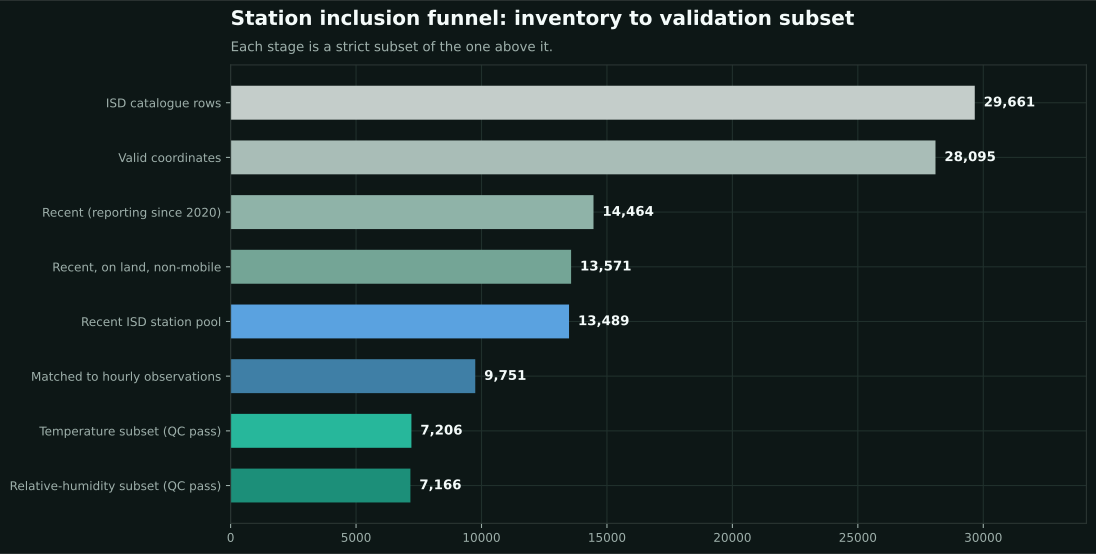
The NOAA Integrated Surface Database lists 29,661 station records. 28,095 have usable coordinates; 14,464 were still reporting in 2020 or later; 13,571 are recent, on land and non-mobile. That is the discovery inventory — the pool Climetry draws from. It is not, by itself, a validation of any Climetry metric.
A station only enters a validation subset once it has a long, complete enough hourly record to define a stable ten-year monthly climatology for that specific variable. After that filter and quality control, 7,053 stations remain. Every step — removing null-island coordinates, test entries, ships and buoys, off-grid points and duplicate-coordinate artifacts — is reproducible from audit_isd_inventory.py.
From inventory to validation subset
Each stage is a strict subset of the one above it.
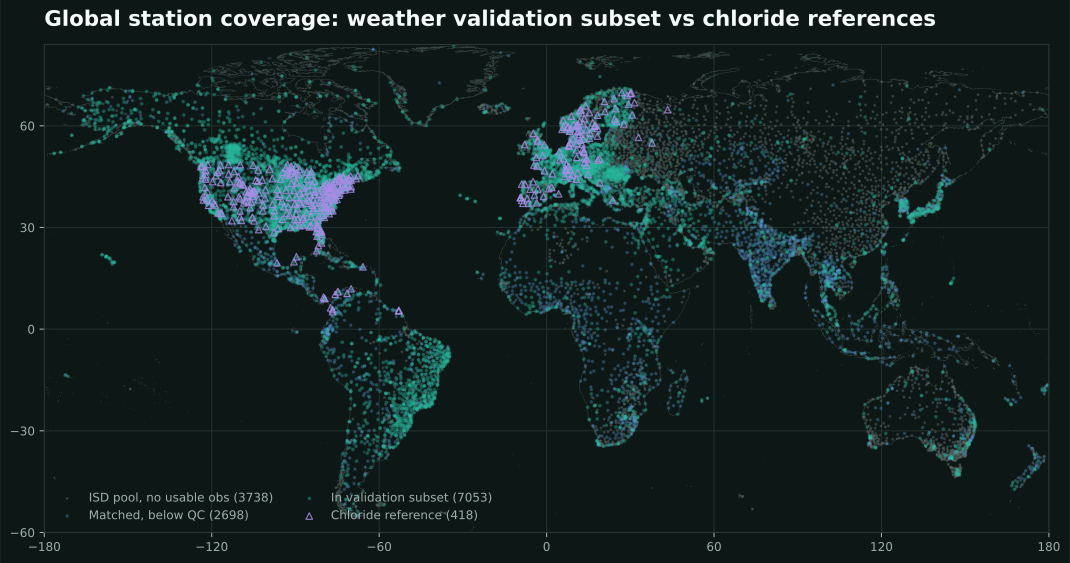
Global station coverage
Weather validation subset (green) against chloride reference stations (purple).
Layer 1
The gridded climate basis agrees with independent station observations.
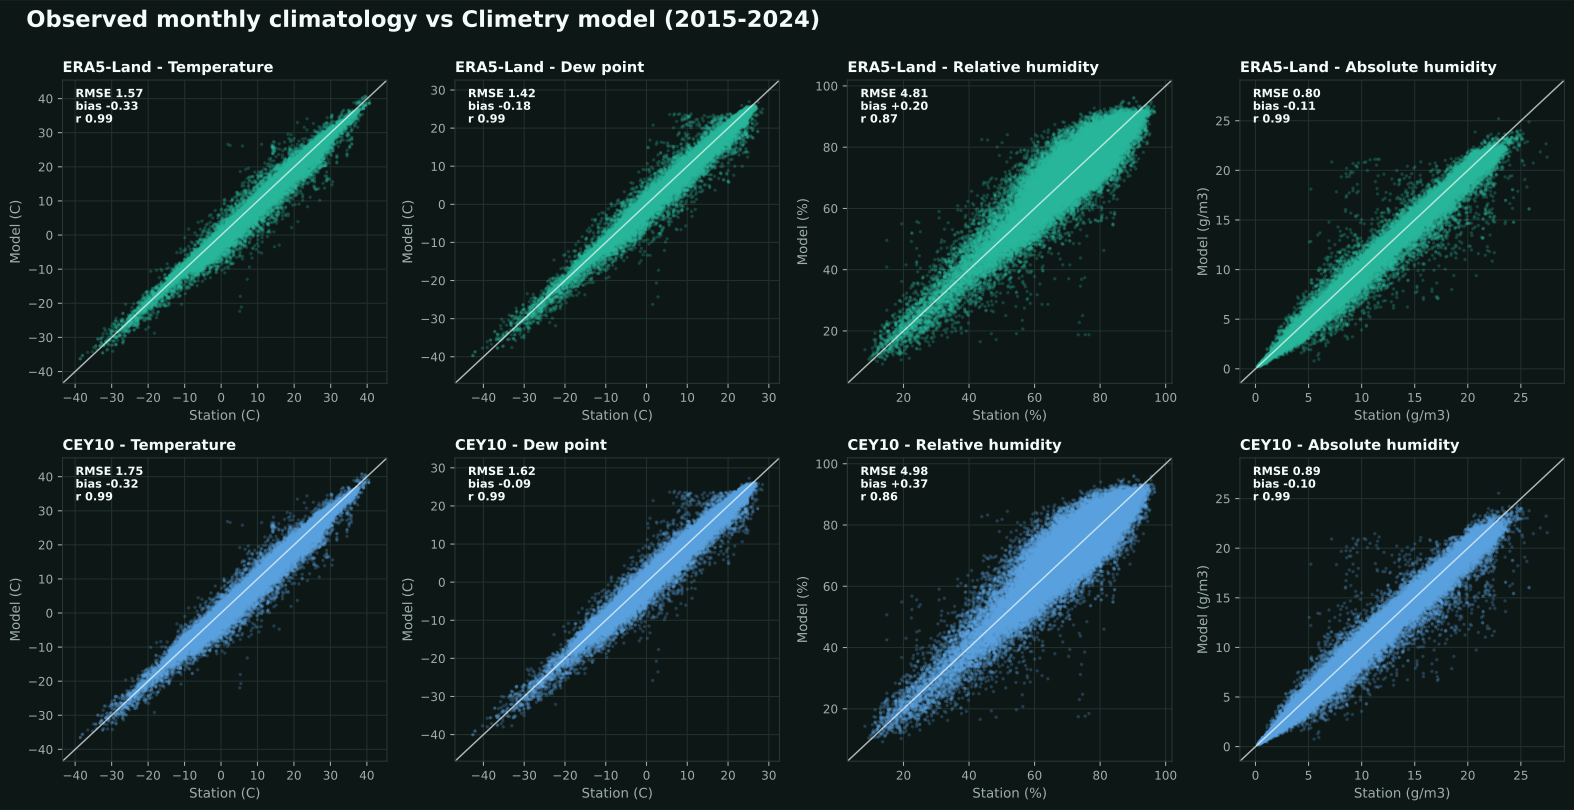
For every station in a variable’s subset, the ERA5-Land 2015–2024 monthly climatology is compared against the station’s own 2015–2024 monthly climatology from independent hourly observations — 7,053 stations, 338,544 station-month pairs. The comparison evaluates long-term climatological representativeness, which is what durability screening needs, not the timing of individual weather events.
ERA5-Land is the land-surface component of the ECMWF/Copernicus ERA5 reanalysis. CEY10, the Climetry representative year, tracks it almost exactly across this comparison (temperature bias −0.32 °C, relative-humidity bias +0.37 %-points).
bias −0.33 °C · −0.08 °C after elevation correction
bias −0.18 °C · Spearman 0.99
bias +0.2 %-pt · essentially unbiased
bias −0.11 g/m³ · Spearman 0.99
Measured vs model monthly values
Every point is one station and one calendar month. The tighter the cloud sits on the diagonal, the closer the model tracks the observation. Top row ERA5-Land, bottom row CEY10.
The residual scatter is elevation, not model error
A weather station sits at one elevation; the model grid cell around it has its own average orography. When the cell is higher than the station, the model reads colder — the temperature bias correlates −0.73 with that height difference, at −5.5 °C per kilometre, which is the atmospheric lapse rate. Correcting for it brings the mean bias to −0.08 °C and the RMSE to 1.0 °C.
Agreement by continent
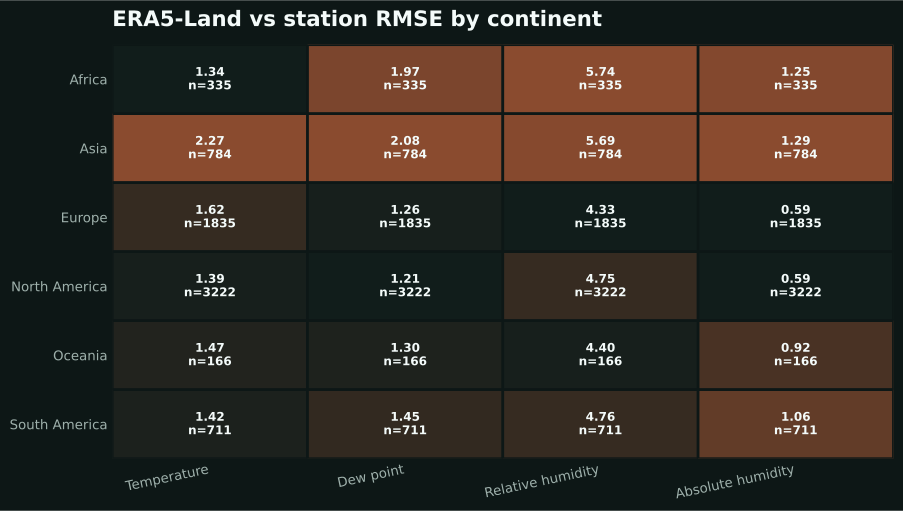
ERA5-Land vs station RMSE per continent and variable, with the station count. Agreement is strongest for temperature, dew point and absolute humidity. Asia carries the largest temperature error, where long public hourly records skew toward higher-altitude and continental sites.
Layer 2
CEY10 is checked against station climatology, not event timing.
A Climetry Environmental Year is a representative 8760-hour sequence built for engineering exposure work. It should preserve the long-term monthly profile and the engineering-relevant duration statistics. It is not meant to reproduce the date of a specific storm, fog event or humidity peak.
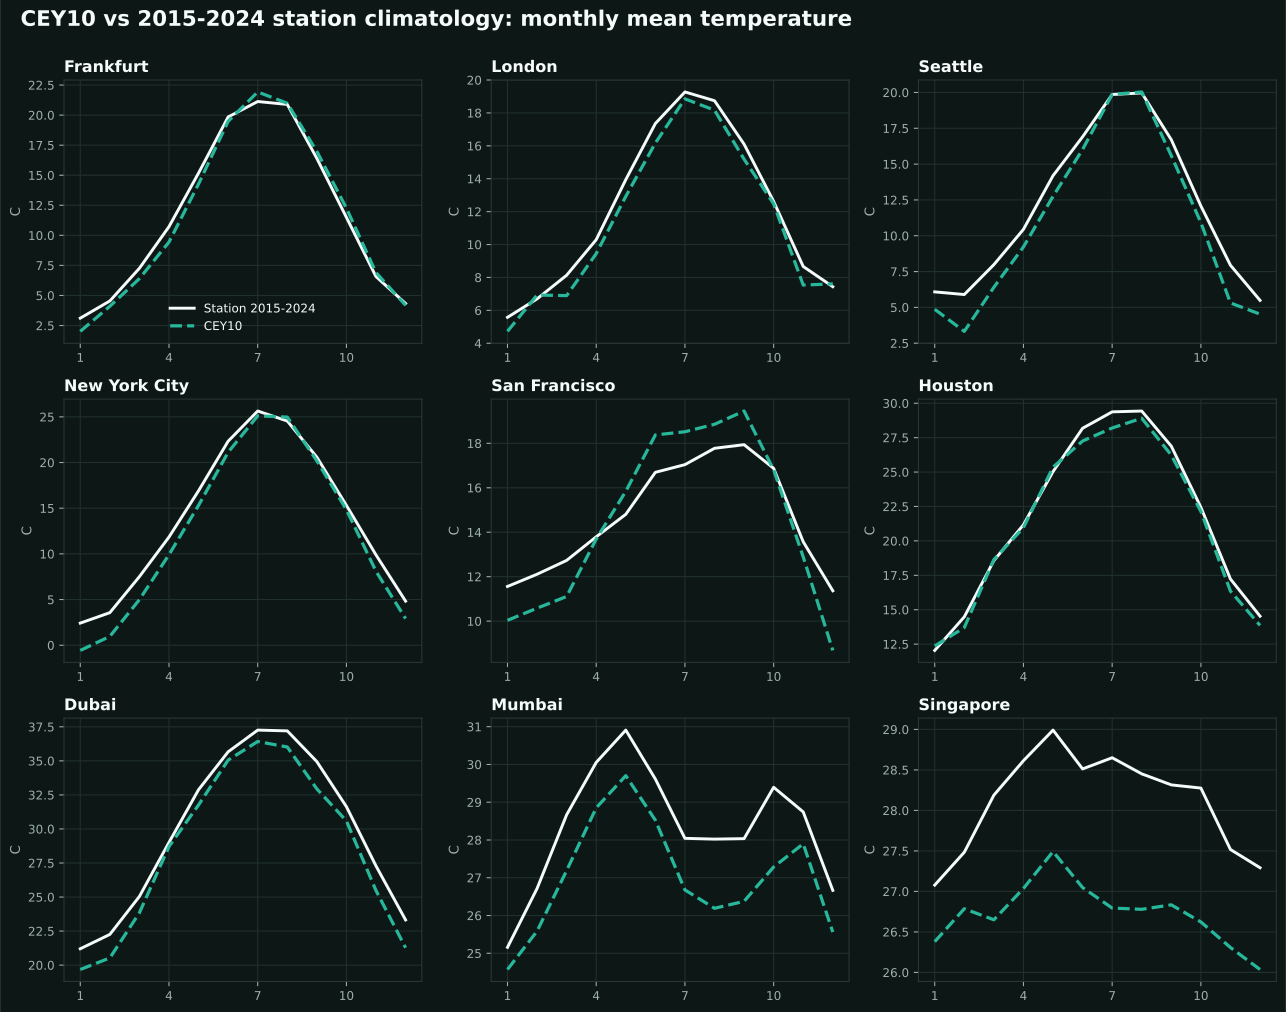
The CEY10 check covers nine cities spanning temperate, marine, humid continental, Mediterranean, humid subtropical, arid coastal and tropical climates. Monthly-profile preservation and hourly-exposure representativeness are reported as two separate questions.
Temperature monthly profile
108 city-month comparisons, R² 0.98
Dew point monthly profile
Moisture-content basis, R² 0.99
Absolute humidity profile
Derived consistently, R² 0.99
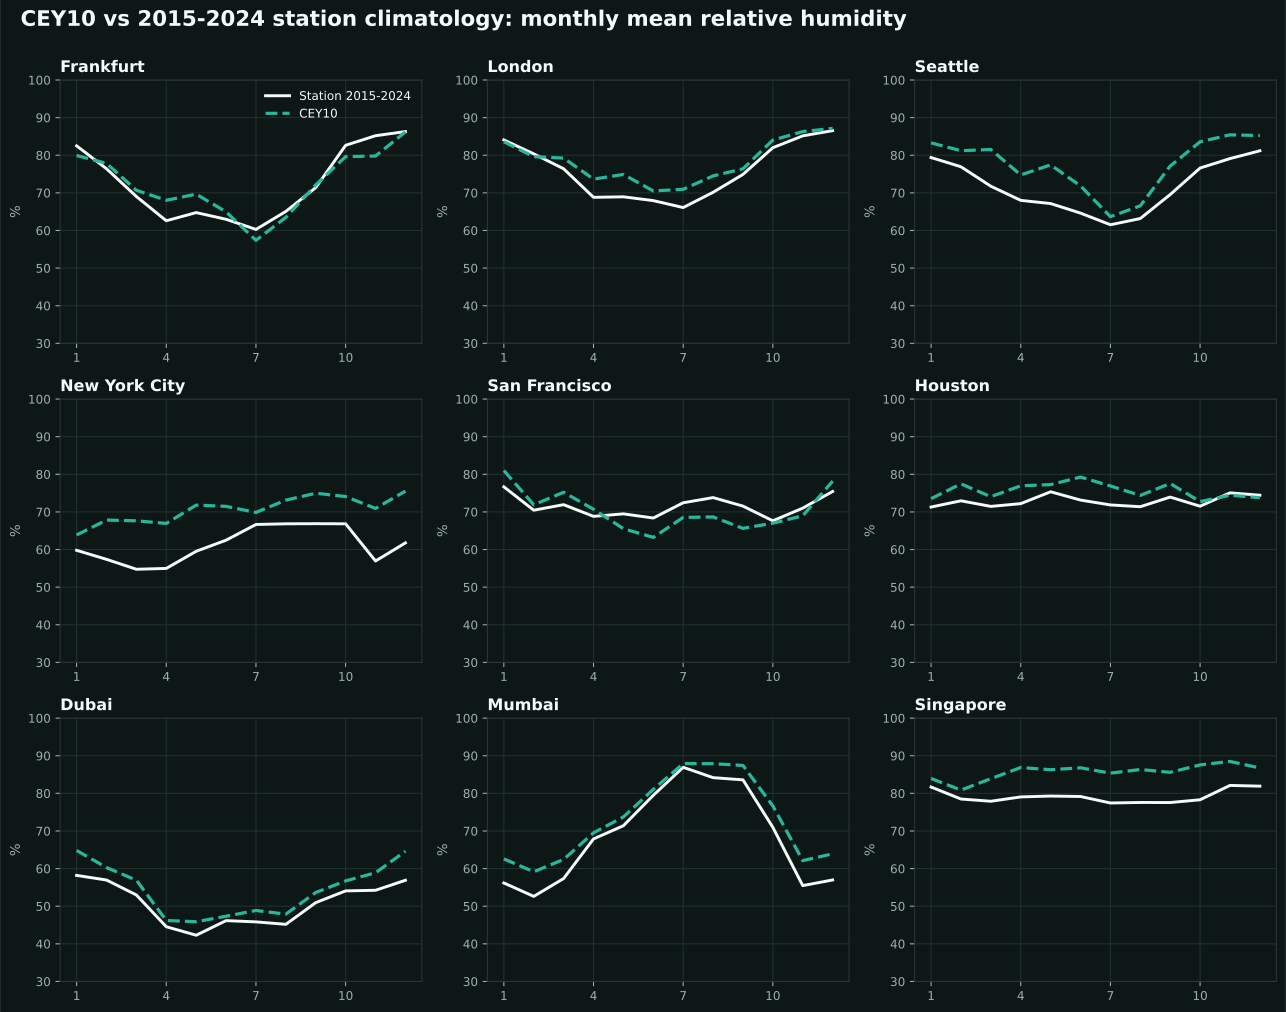
Relative humidity profile
Shape preserved; exposure-hour note below
CEY10 monthly profiles
Solid lines: the 2015–2024 station climatology. Dashed lines: the CEY10 representative year. Temperature (first grid) and relative humidity (second grid), nine cities.
Exposure-hour representativeness
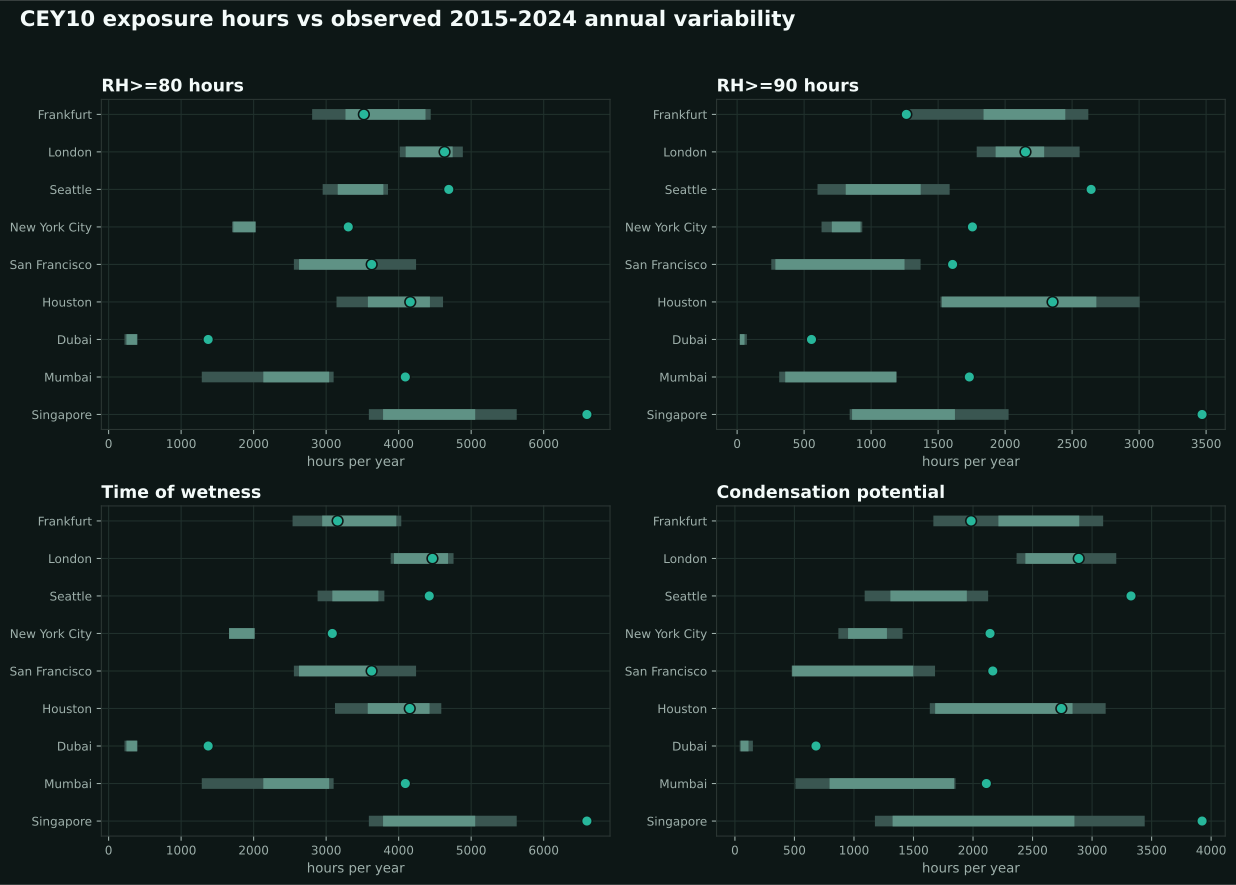
Green points are the CEY10 values. Bands show the observed year-to-year station variability over 2015–2024. This diagnostic is deliberately stricter than a monthly-mean comparison.
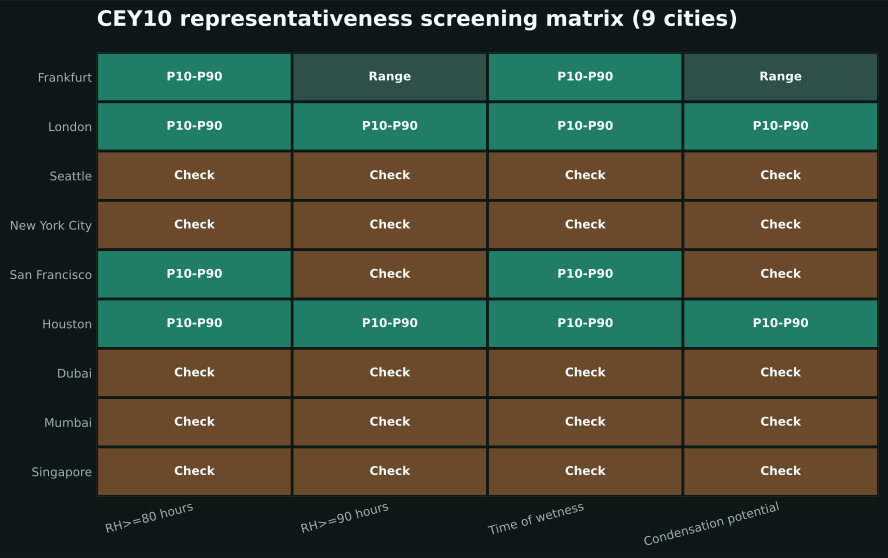
CEY10 screening matrix
“P10–P90” means the CEY10 value lies inside the central observed annual range. “Range” means it stays within the observed annual min–max. “Check” means the CEY–airport comparison for that city and indicator needs the grid-cell context above.
Layer 3
Chloride, sulfate and material models are a separate validation chain.
Atmospheric chloride and sulfate deposition are not covered by the weather-station comparison above. They use a different reference network (418 reference points: 251 NADP/NTN, 90 EBAS/EMEP, 43 EFC corrosion sites) and a different PDE / MERRA-2 hybrid model chain.
Calibrated, deploy-ready chloride solves currently exist for North America and Europe / Mediterranean; Latin America is at calibration status; other regions are screening-grade. The MERRA-2 wet-sulfate model has a computed 96-station NADP comparison with moderate-to-good rank correlation and a documented magnitude bias. None of this validates ISO corrosivity class, corrosion rate or product lifetime.
What this supports, and what it does not.
The evidence supports Climetry’s use of ERA5-Land and CEY10 as an engineering climate-exposure basis for screening, monthly profiles and thermodynamic load characterisation, across the climate zones represented in the validation subset.
It does not validate product lifetime, failure probability, Climetry Exposure Classes, ISO corrosivity classes, chloride deposition, sulfate deposition or customer-specific site microclimates. Those are separate validation chains, documented separately as the product matures.
Traceability
Every number on this page is reproducible.
The whole comparison is one pipeline — weather_station_validation/scripts/run_full_validation.py — that audits the station inventory, downloads the independent observations, extracts the model climatology at each station, runs the statistics and writes the CSV, JSON, Markdown and figure outputs. Each chart traces back to its source table; the full method, exact counts and caveats are in the validation report at docs/methodology/weather_station_validation_basis.md.
NOAA ISD
Integrated Surface Database station history — the global weather-station inventory.
NOAA NCEI ISDERA5-Land
ECMWF/Copernicus land-surface reanalysis — the gridded climate basis (354,592 land points).
ECMWF ERA5-LandMeteostat
Public hourly weather-station observations used for the independent comparison.
MeteostatNADP / EBAS
Deposition-chemistry networks used for the separate chloride and sulfate validation.
NADPFrequently asked questions
Is every Climetry output validated by 14,000+ weather stations?
No — and the page is explicit about it. 14,464 is the count of NOAA ISD weather stations with valid coordinates still reporting since 2020; that is the observational inventory Climetry draws candidates from. The quantitative comparison uses metric-specific validation subsets: a station is admitted to the temperature, dew-point or humidity subset only if it has enough independent long-term hourly observations to define a stable 2015–2024 monthly climatology for that variable. That currently gives 7,053 stations and 338,544 station-month comparisons.
What is actually compared against the stations?
ERA5-Land monthly climatology (2015–2024) is compared against independent station monthly climatology for air temperature, dew point, relative humidity and absolute humidity. CEY10 representative-year values are compared against the same station climatology for nine city pilots.
How close is the agreement?
Across 7,053 stations on every populated continent: temperature RMSE 1.6 °C (bias −0.3 °C), dew point RMSE 1.4 °C, absolute humidity RMSE 0.8 g/m³, relative humidity RMSE 4.8 %-points with near-zero bias. CEY10 tracks ERA5-Land almost exactly. Most of the residual temperature scatter is grid-cell-versus-point elevation representativeness — the temperature bias correlates −0.73 with the model-cell-height-minus-station-elevation difference, and a lapse-rate correction cuts the mean bias to −0.08 °C and the RMSE to 1.0 °C.
Is this a validation of Climetry Exposure Classes or corrosion?
No. This page validates parts of the climate-data basis. CE classes, corrosion indicators, chloride layers, sulfate layers and product-specific failure mechanisms are separate validation chains and are summarised separately.
What did the CEY10 pilot show?
CEY10 preserves monthly thermodynamic profiles well across all nine cities (temperature RMSE 1.3 °C, R² 0.98). Exposure-hour indicators sit inside observed annual variability for the temperate and marine cities; the coastal-megacity airport pilots (Dubai, Singapore, Mumbai, New York, Seattle) show CEY10 reading more high-humidity hours than the airport observes, because the grid cell is partly marine and cooler than a warm airport tarmac. The 7,053-station comparison shows the humidity bias is near zero, so exposure hours are kept as a diagnostic gate rather than a validated output.