Overview
Every Climetry exposure metric, from RH80 hours to a Plastic Ageing Exposure Class, is built on the same small set of physical quantities: air temperature, dew point, relative and absolute humidity, and the deposition of chloride and sulfate onto a surface. This page defines those quantities once, in the exact terms Climetry computes them, so the same definitions hold whether you are reading a report, the methodology reference or a chart on the analysis workspace.
This is an introductory primer, not a certified corrosion or materials-testing standard. For ISO 9223 corrosion classification and Plastic Ageing Exposure Screening methodology, see the methodology page. For the full electrochemical migration mechanism and reliability models, see the humidity-induced electronic degradation report.
Relative and absolute humidity
Relative humidity (RH) is a ratio, not an amount of water. It compares the actual water-vapor pressure in the air to the maximum vapor pressure the air could hold at its current temperature (the saturation vapor pressure). Because saturation vapor pressure rises steeply with temperature, the same amount of water vapor produces a lower RH in warm air and a higher RH in cool air.
Climetry derives RH from dew-point temperature rather than measuring vapor pressure directly, because reanalysis climate data reports dew point. The saturation vapor pressure at the dew point equals the actual vapor pressure of the air, so the same ratio applies with the dew point standing in for the vapor term:
Absolute humidity is different: it is the actual mass of water vapor per volume of air (grams per cubic meter), independent of temperature. Two air masses with identical absolute humidity can show very different RH values if their temperatures differ, which is why Climetry reports both. A tropical night can carry a persistently high absolute humidity even during hours when RH briefly dips.
Here e is water-vapor pressure in hectopascals and T is air temperature in Celsius, so T + 273.15 converts to Kelvin. The constant 216.7 comes from the molar mass of water and the universal gas constant, and yields absolute humidity in g/m3.
| Quantity | What it measures | Depends on temperature? |
|---|---|---|
| Relative humidity (RH) | How close the air is to saturation, as a percentage | Yes, strongly |
| Absolute humidity (AH) | Mass of water vapor per volume of air | No |
| Dew point | Temperature at which the air's current moisture content would saturate it | Defines a temperature, not a ratio |
Dew point and condensation
Dew point is the temperature air would have to cool to, at constant pressure and moisture content, to become fully saturated (RH = 100%). Condensation becomes possible once a surface reaches or drops below the surrounding air's dew point. This is why the decisive temperature for corrosion and electronics risk is often a specific surface, such as a connector pin, PCB trace, enclosure wall or shaded panel back-sheet, rather than the ambient air temperature reported by a weather station.
A small or negative dew-point margin signals elevated condensation risk. Climetry's condensation potential and Time of Wetness indicators are screening estimates built from this margin together with humidity and temperature context, not a measurement of moisture on a specific product surface.
Thermodynamics in a Climetry report
Climetry does not model heat and mass transfer inside a specific product enclosure. It characterizes the outdoor thermodynamic boundary condition that a product or structure is exposed to: hourly air temperature, dew point, relative and absolute humidity, and derived exposure statistics across a representative year.
| Climetry indicator | Built from |
|---|---|
| RH80 / RH90 exposure hours | Hours where RH computed from dew point is at least 80% or 90% |
| Condensation potential | Dew-point margin, humidity and temperature context |
| Time of Wetness | Humidity and temperature exposure as a wetness-duration screening approximation |
| Climetry Environmental Year (CEY) | 8760 representative hours preserving the hourly distribution these thermodynamic indicators need |
These indicators intentionally preserve hourly variability rather than collapsing straight to an annual average, because persistent high-humidity or near-dew-point hours can drive real degradation even when the annual mean RH looks unremarkable.
Corrosion damage mechanisms
Atmospheric corrosion is an electrochemical process: a metal surface needs an electrolyte film (from adsorbed or condensed moisture), dissolved ionic species, and enough time in that wetted state for anodic and cathodic reactions to proceed. ISO 9223 formalizes this with a dose-response approach that combines Time of Wetness with pollutant deposition rates.
| Driver | Typical source | Effect |
|---|---|---|
| Time of Wetness | Humidity and temperature exposure | Sets how long a surface carries a conductive electrolyte film |
| Chloride deposition | Marine aerosol, coastal proximity, road salt | Destabilizes passive oxide films, drives pitting and localized corrosion |
| Sulfate / SO2 | Industrial and urban pollution | Drives more uniform atmospheric corrosion, especially on steel and zinc |
| Temperature | Ambient and surface exposure | Modifies reaction rate within the dose-response formula |
Climetry runs this dose-response formula for steel, zinc, copper and aluminum, using real chloride and sulfate deposition inputs where available and falling back to a regional background sulfate estimate when local sulfate data is not resolved. See the methodology page for the exact ISO-derived corrosion indicators and how they relate to a location's overall Climetry Exposure Class.
ISO corrosion formulas used by Climetry
For corrosion-rate screening, Climetry evaluates ISO 9223-style first-year dose-response functions for four reference metals. The inputs are air temperature T, relative humidity RH, sulfur deposition proxy Pd and chloride deposition Sd. The result is a first-year corrosion-rate estimate in micrometers per year.
| Metal | A | n | a | alpha | beta | B | m | b | c |
|---|---|---|---|---|---|---|---|---|---|
| Carbon steel | 1.77 | 0.52 | 0.020 | 0.150 | -0.054 | 0.102 | 0.62 | 0.033 | 0.040 |
| Aluminum | 0.0042 | 0.73 | 0.025 | 0.009 | -0.043 | 0.0018 | 0.60 | 0.020 | 0.094 |
| Zinc | 0.0129 | 0.44 | 0.046 | 0.038 | -0.071 | 0.0175 | 0.57 | 0.008 | 0.085 |
| Copper | 0.0053 | 0.26 | 0.059 | 0.126 | -0.080 | 0.01025 | 0.27 | 0.036 | 0.049 |
Climetry reports these outputs as screening rates, not certified material-loss guarantees. The product keeps the input provenance visible because chloride and sulfate can come from different data systems, spatial resolutions and calibration states.
Electrochemical migration, briefly
Electrochemical migration (ECM) is a related but distinct mechanism from general atmospheric corrosion. It requires an electrolyte film, ionic contamination and a voltage bias between conductors close enough together. Metal dissolves at the anode, migrates through the electrolyte and deposits near the cathode, and repeated cycles can grow a branching dendrite that eventually bridges the gap and causes a short or intermittent leakage.
ECM matters most for electronics with fine conductor spacing and exposed metal under bias, rather than for bulk structural or enclosure corrosion. It is covered in full depth, including dendrite growth, conductive anodic filament (CAF) growth and acceleration models, in the dedicated technical report.
Plastic and elastomer degradation
Polymers and elastomers age through four physical stressors, which Climetry scores as four separate channels before combining them into a single class. Each channel targets a different chemical or physical mechanism in the material.
| Channel | Mechanism | Typical trigger |
|---|---|---|
| UV photo-oxidation | Solar radiation breaks polymer bonds and initiates oxidative chain reactions | Cumulative UV dose, especially at high altitude or low latitude |
| Ozone / elastomer cracking | Ozone attacks carbon-carbon double bonds in strained rubber and elastomers | Ambient ozone concentration combined with mechanical strain |
| Thermal oxidation | Sustained heat accelerates oxidative degradation independent of light | High ambient or surface temperature, especially with thermal cycling |
| Hydrolysis / moisture | Water attacks susceptible polymer chemistries such as esters and polyamides | Persistent humidity or condensation exposure |
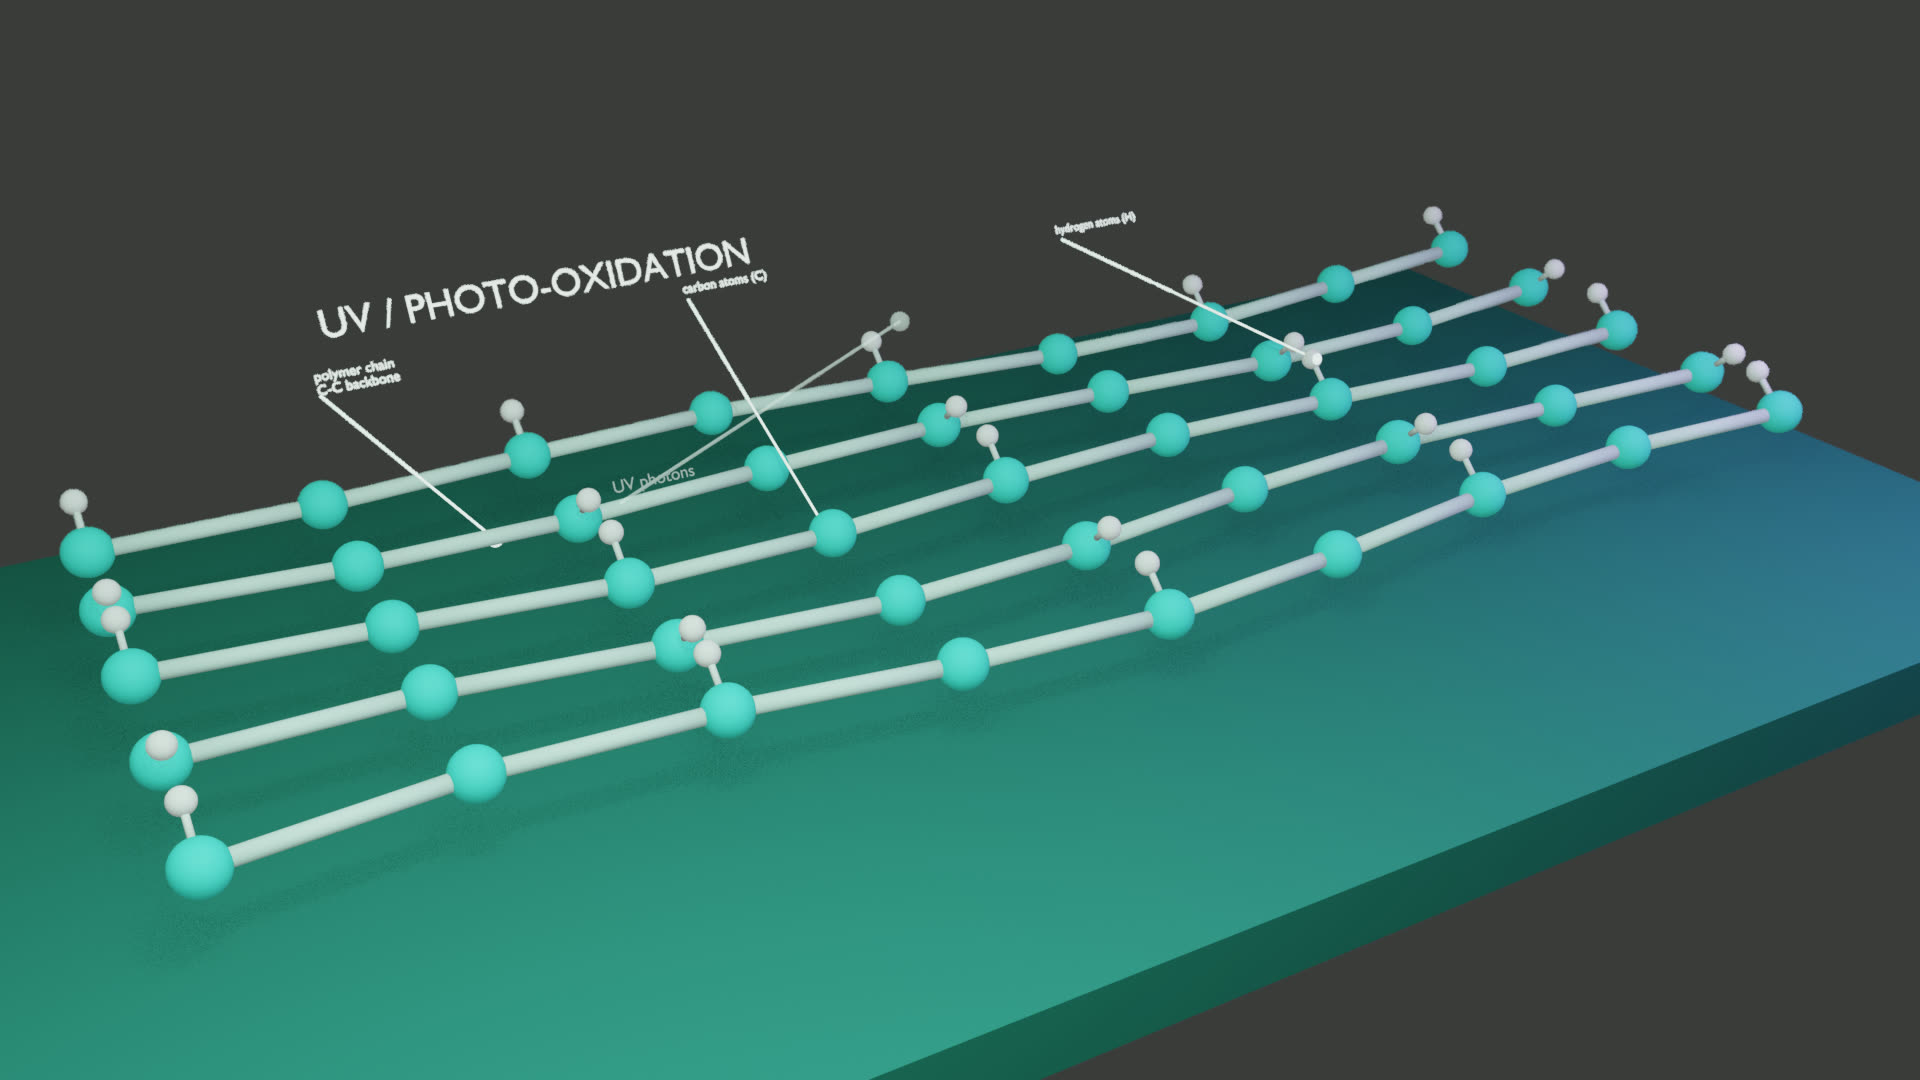
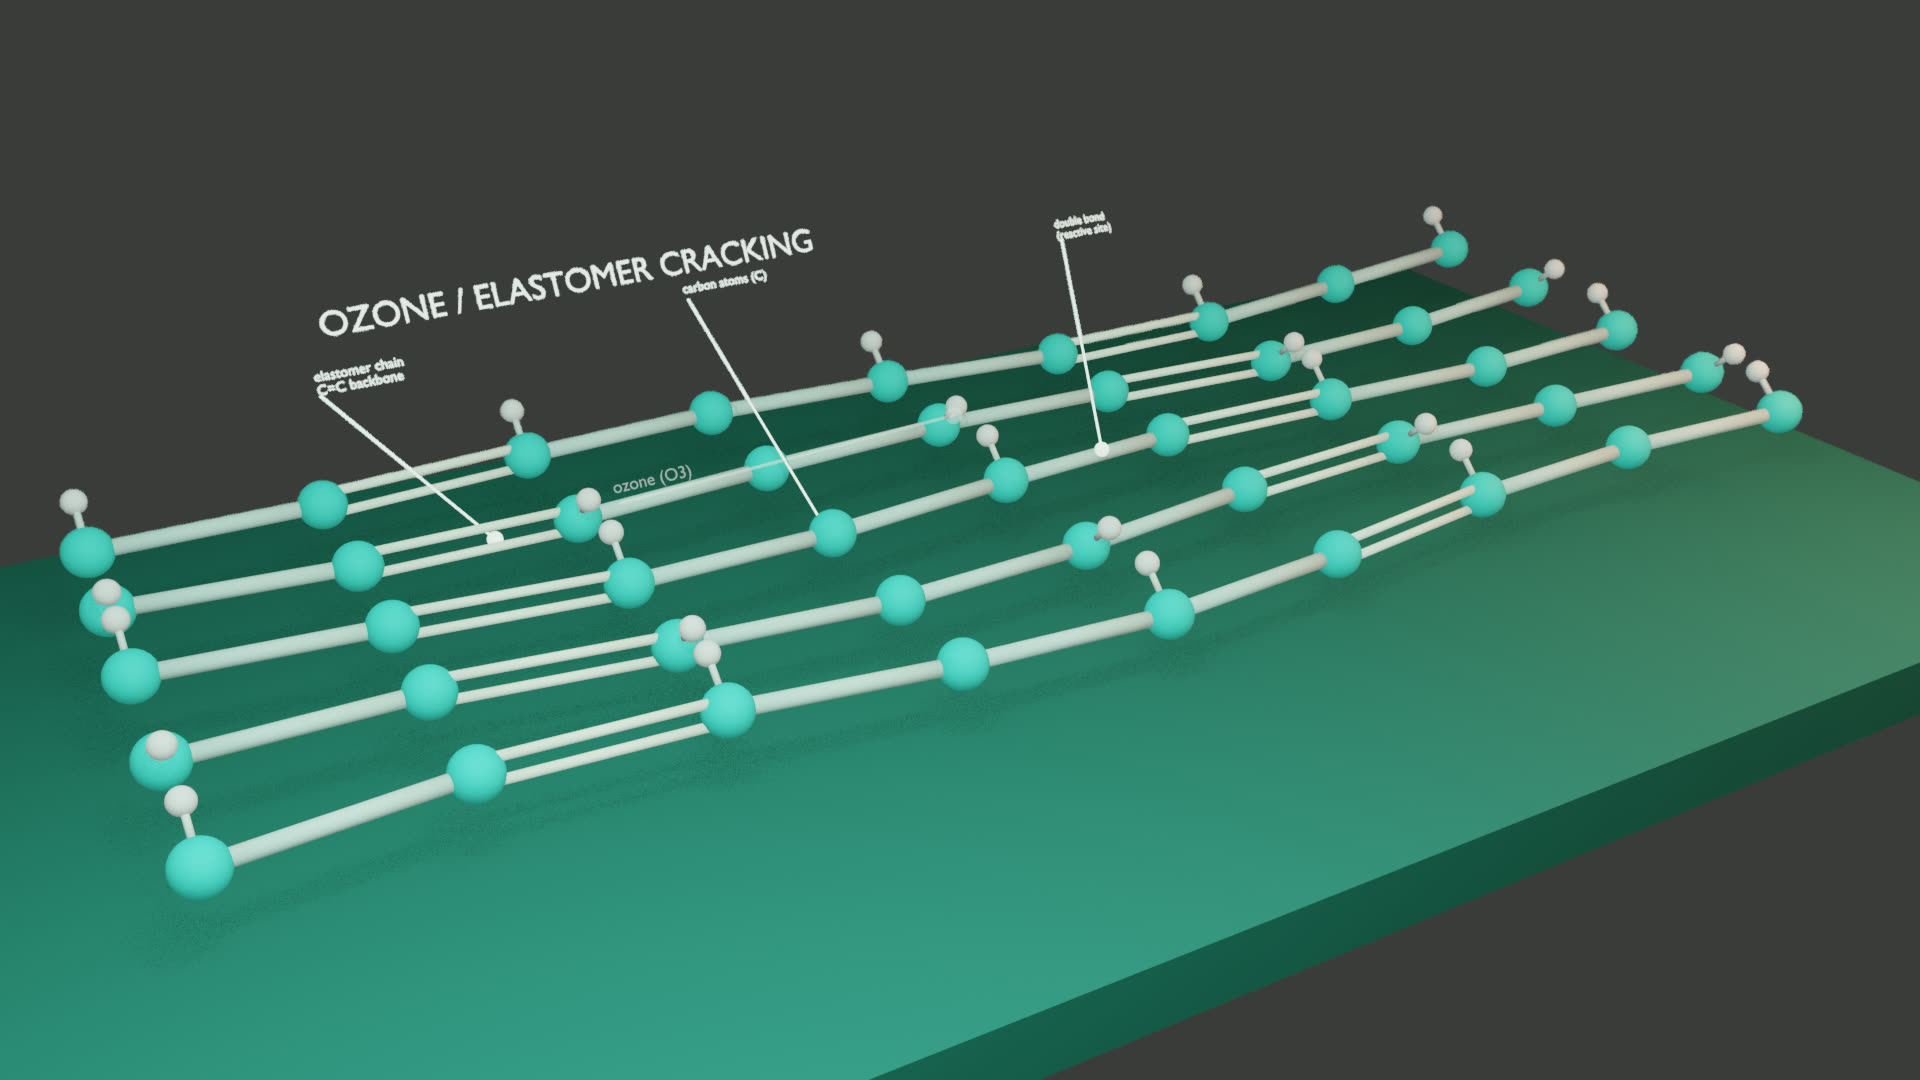
Climetry combines the four channels into a Plastic Ageing Exposure Class from PAE-1 (mild) to PAE-5 (severe), reported both as an annual figure and as a monthly profile. PAE classes are screening indicators, not laboratory exposure classes under ISO 4892 or ASTM G154/D1149. See the methodology page for the exact class definitions, and the plastic ageing article for a narrative walkthrough of all four mechanisms.
Plastic ageing formulas used by Climetry
The Plastic Ageing Exposure Index is built from four channel scores. Each channel is clipped to a 0-100 engineering screening range before the weighted index is calculated. Missing channels are removed from the denominator and lower the confidence label.
The current model version is Climetry Plastic Ageing v0.2. It is intentionally an exposure-screening model: it ranks environmental stress at a location and supports material selection, but final service-life prediction still requires product geometry, material grade, stabilizer package, color, surface temperature and validation testing.
Glossary
These core terms recur across every Climetry report and chart. They are defined once here and reused consistently everywhere else.
Climetry
Climetry is a climate exposure intelligence platform for durability, corrosion, condensation and reliability screening.It transforms climate and atmospheric datasets into engineering-oriented exposure metrics and reports.
Climate Exposure Intelligence
Climate Exposure Intelligence converts climate data into engineering indicators for environmental severity and qualification support.It focuses on exposure hours, thresholds, percentiles, corrosion drivers, condensation potential and location comparison rather than forecasts.
Climetry Environmental Year (CEY)
CEY is an 8760-hour representative environmental year derived from long-term climate data for durability and exposure analysis.CEY preserves hourly distributions needed for RH80, RH90, condensation, wetness and thermal-cycle calculations.
Climetry Exposure Class (CE)
CE is a location-based environmental severity class for corrosion, condensation, humidity and durability screening.CE classes summarize overall environmental severity and are not ISO 9223 corrosivity categories.
RH80 / RH90 exposure
RH80 and RH90 are counts of hours where relative humidity is at least 80% or 90%.These thresholds reveal persistent high-humidity exposure that annual averages can hide.
Condensation potential
Condensation potential estimates hours where air conditions create elevated surface-wetting risk.It is a screening indicator based on dew point, humidity and temperature context, not a measurement on a specific product surface.
Time of Wetness
Time of Wetness is the duration of conditions where surfaces are likely to remain wet enough to support corrosion processes.Climetry uses humidity and temperature exposure as a screening approximation for wetness-related environmental loading.
ISO-derived corrosivity indicators
ISO-derived corrosivity indicators estimate material-related atmospheric corrosivity from environmental inputs.They are separate from Climetry Exposure Classes and should be interpreted as screening indicators, not certified ISO site classifications.
ISO 9223 dose-response function
An empirical atmospheric-corrosion equation that estimates first-year corrosion rate from temperature, relative humidity, sulfur deposition and chloride deposition.Climetry uses these equations as engineering screening indicators, not as a certified site classification.
Chloride deposition
A deposited chloride load, commonly expressed as milligrams of chloride per square meter per day.Marine aerosol, salt lakes and road salt can contribute through different physical mechanisms that should remain traceable.
Sulfate deposition
A sulfur-related atmospheric deposition load used as a corrosion-relevant pollution background.Climetry uses MERRA-2 sulfate background where available and labels sulfur transport products separately when they are screening-only.
Plastic Ageing Exposure Index
A Climetry screening index combining UV photo-oxidation, ozone elastomer attack, thermal oxidation and moisture or hydrolysis stress.It supports material-selection and qualification planning, but does not replace material-specific lifetime testing.
Basics FAQ
What is the difference between relative and absolute humidity?
Relative humidity (RH) is the ratio of the actual water-vapor pressure to the saturation vapor pressure at the current air temperature, expressed as a percentage. Absolute humidity is the actual mass of water vapor per volume of air (g/m3), independent of temperature. Air can carry a high absolute humidity while showing a low RH simply because it is warm, and the same absolute humidity can show a much higher RH once the air cools.
Why does dew point matter more than relative humidity alone?
Dew point is the temperature at which air becomes saturated and condensation can begin. A surface at or below the dew point of the surrounding air can accumulate moisture even if the ambient RH reading looks moderate, because the surface, not the air, decides whether condensation forms. Climetry tracks the dew-point margin between air and reference surface temperature for this reason.
How does Climetry compute relative humidity?
Climetry derives relative humidity from dew-point temperature using the ratio of saturation vapor pressure at the dew point to saturation vapor pressure at air temperature, then clips the result to a physically valid 0-100% range. This is mathematically the same RH = p_v / p_sat(T) relationship used throughout atmospheric science, applied to dew-point inputs from reanalysis climate data.
Is chloride or sulfate more important for corrosion risk?
Both matter, but they act differently. Chloride deposition tends to dominate in marine and coastal environments and is a strong driver of pitting and localized corrosion. Sulfate and SO2 exposure tends to dominate in industrial and urban environments and drives more uniform atmospheric corrosion. Climetry's ISO 9223 dose-response corrosion rates combine both drivers with temperature and humidity, and fall back to a regional background estimate when local sulfate data is unavailable.
Does this page replace the electrochemical migration (ECM) report?
No. This page summarizes ECM as one of several corrosion-adjacent mechanisms so it sits consistently alongside dew point, humidity and plastic ageing. For the full mechanism, equations and reliability models, see the dedicated technical report on humidity-induced electronic degradation.
What triggers plastic and elastomer ageing?
Four physical stressors dominate: UV photo-oxidation from solar radiation, ozone attack on strained elastomers, thermal oxidation from sustained heat, and hydrolysis from moisture attacking susceptible polymer chemistries. Climetry scores these as four channels that combine into a Plastic Ageing Exposure Class from PAE-1 (mild) to PAE-5 (severe).
Which ISO 9223 corrosion formulas does Climetry use?
Climetry evaluates ISO 9223-style dose-response equations for carbon steel, zinc, copper and aluminum. The inputs are temperature, relative humidity, chloride deposition and sulfur deposition. Results are reported as first-year corrosion-rate screening estimates in micrometers per year.
What is the Plastic Ageing Exposure Index formula?
The current Climetry plastic-ageing model combines four channel scores: 40% UV photo-oxidation, 20% ozone or elastomer cracking, 25% thermal oxidation and 15% moisture or hydrolysis. Missing channels are removed from the denominator and lower the confidence label.
These definitions drive every metric on the Climetry analysis workspace, from RH80 exposure hours to corrosion rates and Plastic Ageing Exposure Class.