India climate exposure

Mumbai Climate Exposure: Monsoon Humidity and Marine Corrosion Exposure

Mumbai is a severe coastal tropical environment where monsoon humidity and marine aerosols create persistent environmental stress.

Analyze Mumbai
Climate exposure summary
CE-5Tropical Marine Exposure
  • Very high monsoon humidity
  • Elevated marine chloride influence
  • Increased corrosion risk

Marine corrosion is the primary stressor. Monsoon humidity is the secondary driver for reliability and field durability decisions.

CE classes describe overall environmental severity and are not equivalent to ISO corrosivity classes.

Dominant mechanismsMonsoon humidityMarine aerosol and chlorideCondensation potential
Humid Tropical CoastalVery high humidityStrong coastal marine exposure
Mumbai19.076, 72.878
Engineering Climate Fingerprintâ„¢

Mumbai environmental load barcode.

A normalized 0-100 matrix showing which exposure mechanisms dominate the deployment environment. Scores describe environmental load intensity, not failure probability.

ECF patternPrimary: Pollution · Secondary: Humidity
Humidity91Severe
Condensation78High
Thermal42Moderate
Marine82High
Pollution94Severe
Freeze0Minimal
Humidity: Monsoon RH80/RH90 and absolute humidityCondensation: High dew points and wet-season near-saturationThermal: Warm dwell and pre-monsoon heatMarine: Marine aerosol and chloride proxyPollution: CAMS SO2, PM and urban aerosol contextFreeze: Frost hours and freeze-thaw relevance
Typical Applications

Equipment categories where this climate profile is relevant.

ElectronicsPVTelecomIndustrial EquipmentBESSOutdoor Electronics
Why this climate matters

Why Mumbai climate matters

Monsoon humidity and marine aerosols create persistent environmental stress for products and infrastructure deployed in Mumbai.

High dew points, warm temperatures and coastal exposure can keep surfaces and enclosures in moisture-relevant conditions for long periods.

Mumbai is a strong screening case for corrosion-sensitive hardware, telecom infrastructure, solar/BESS equipment and outdoor electronics used in tropical coastal markets.
Engineering metrics

Exposure metrics that matter before deployment.

Climetry-derived indicators summarize environmental severity. ISO-derived indicators estimate material-related atmospheric corrosivity for metals such as carbon steel, zinc, copper and aluminum.

Climate Exposure SummarySevere coastal tropical

Marine humidity and monsoon exposure dominate.

Corrosion RiskSevere

Coastal chloride proxy and wet hours are both high.

Condensation RiskHigh

Long periods near saturation during humid seasons.

RH80 Hours4,091 h/year

CEY10 very long corrosion-relevant exposure duration.

RH90 Hours1,733 h/year

CEY10 extreme humidity is a recurring environmental load.

Climate ClassificationHumid Tropical Coastal

High moisture, high marine influence, warm temperatures.

Monthly climate profile

Mumbai thermodynamic exposure by month.

Preview profiles show monthly min-max envelopes, P10-P90 percentile bands, and monthly means for the core thermodynamic variables.

Relative humidity

76 % annual mean

Monsoon season drives very high RH and long wet-hour exposure.

46 %75 %104 %JanFebMarAprMayJunJulAugSepOctNovDec
Min-max P10-P90 Mean
Air temperature

27.6 C annual mean

Warm temperatures persist; pre-monsoon heat adds thermal stress.

15.3 C27.5 C39.7 CJanFebMarAprMayJunJulAugSepOctNovDec
Min-max P10-P90 Mean
Absolute humidity

19.8 g/m3 annual mean

Moisture content becomes severe during monsoon months.

9.1 g/m319.5 g/m329.9 g/m3JanFebMarAprMayJunJulAugSepOctNovDec
Min-max P10-P90 Mean
Dew point

22.3 C annual mean

High dew points indicate strong condensation and corrosion relevance.

11.0 C21.9 C32.7 CJanFebMarAprMayJunJulAugSepOctNovDec
Min-max P10-P90 Mean
Hourly CEY engineering statistics

Mumbai representative-year diagrams.

These figures are calculated from the local hourly Climetry Environmental Year and translate thermodynamic climate data into engineering-readable duration, cycle and moisture-risk views.

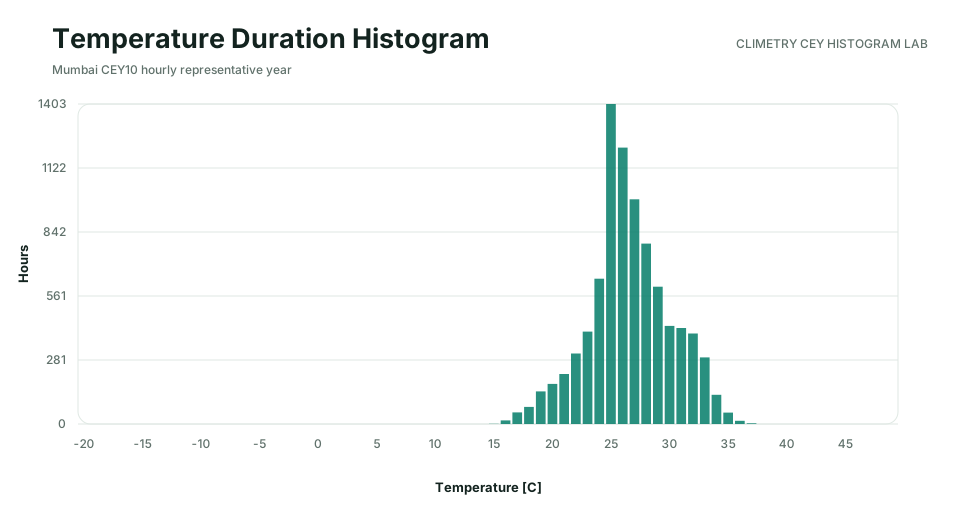
Mumbai CEY10 temperature duration

CEY10 temperature duration

Mumbai's 1 C temperature-duration histogram is calculated from the selected hourly CEY10 source months. It shows how long products experience each outdoor temperature band during the representative year.

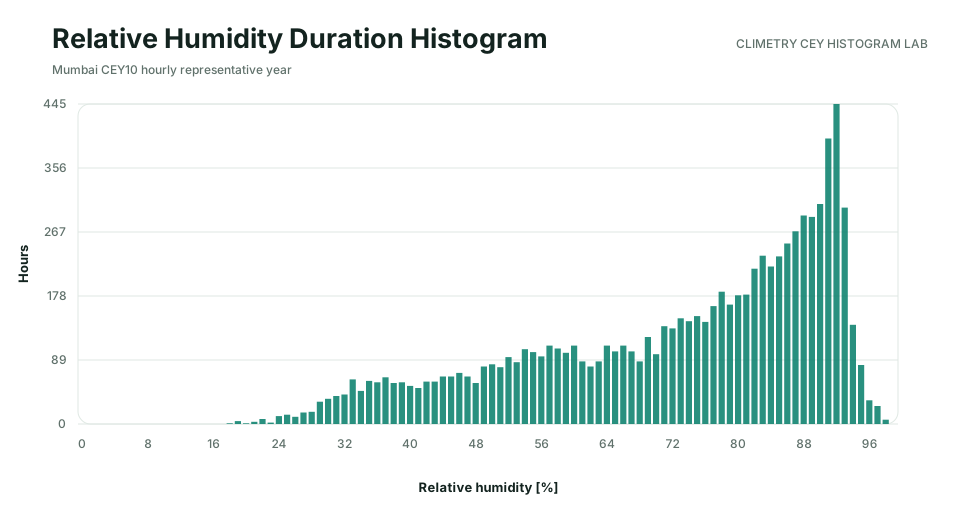
Mumbai CEY10 relative humidity duration

CEY10 relative humidity duration

The RH duration histogram translates relative humidity into annual exposure hours. It supports moisture-sensitive electronics, coating, connector and enclosure screening.

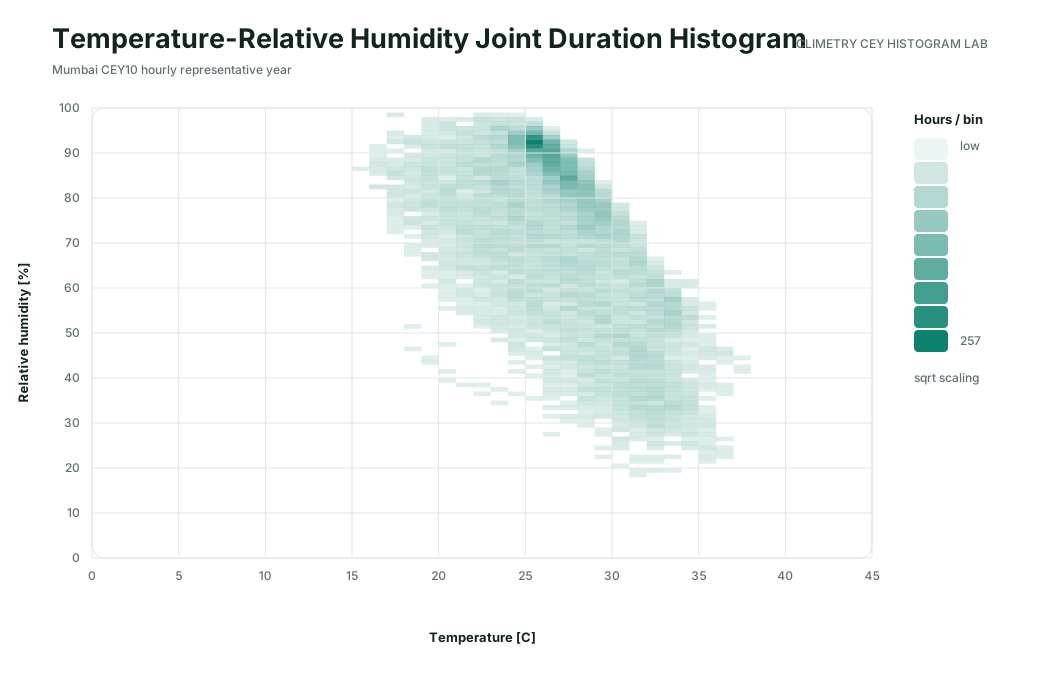
Mumbai Temperature x RH occurrence

Temperature x RH occurrence

The joint duration heatmap shows which temperature and humidity combinations occur together. This is more useful for durability screening than separate annual averages.

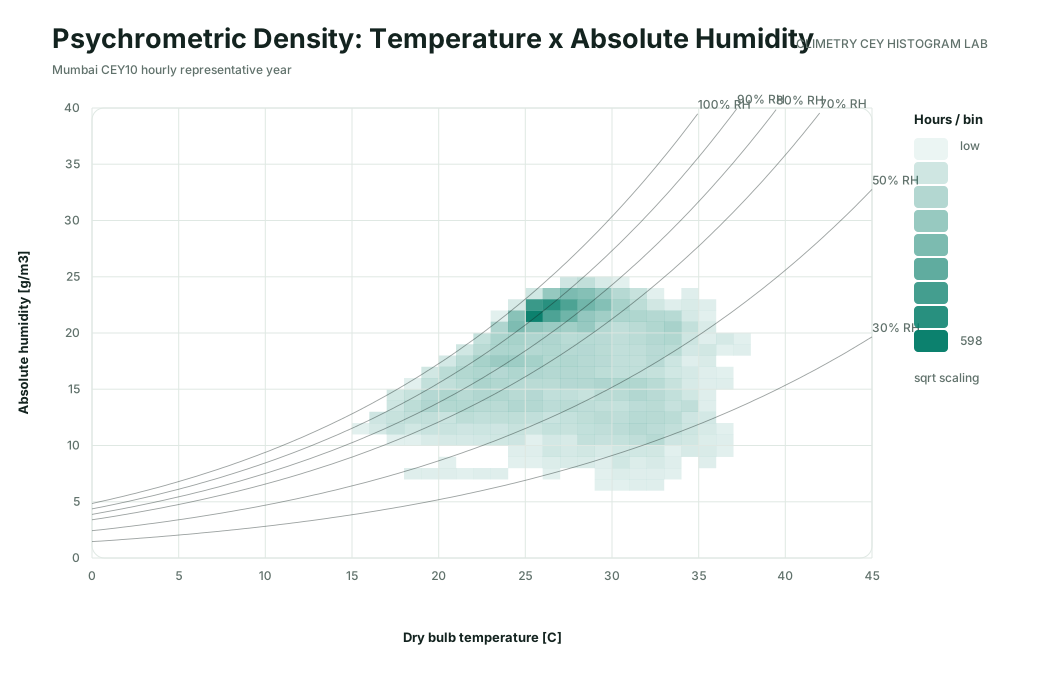
Mumbai Psychrometric moisture density

Psychrometric moisture density

The psychrometric density view connects dry-bulb temperature with absolute humidity and helps identify moisture-rich operating conditions and drying limitations.

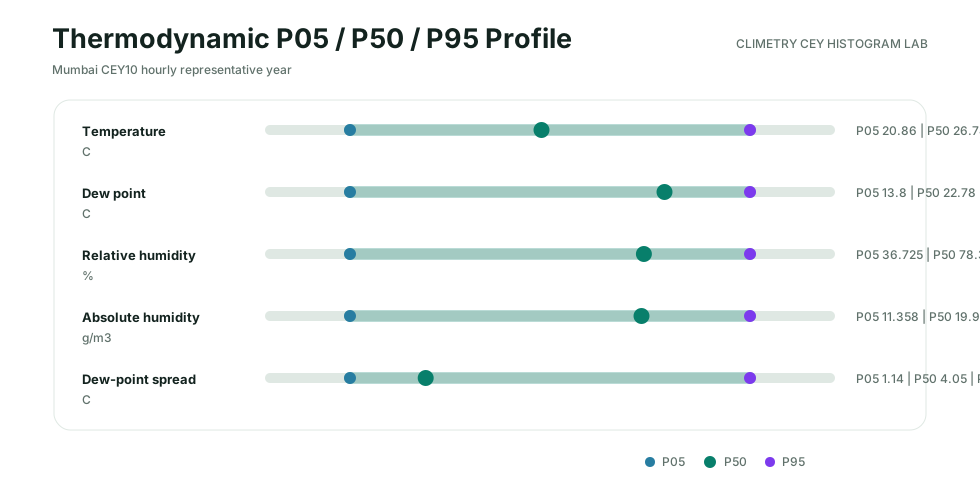
Mumbai P05 / P50 / P95 thermodynamic profile

P05 / P50 / P95 thermodynamic profile

The percentile profile summarizes the representative spread of temperature, dew point, relative humidity, absolute humidity and dew-point margin.

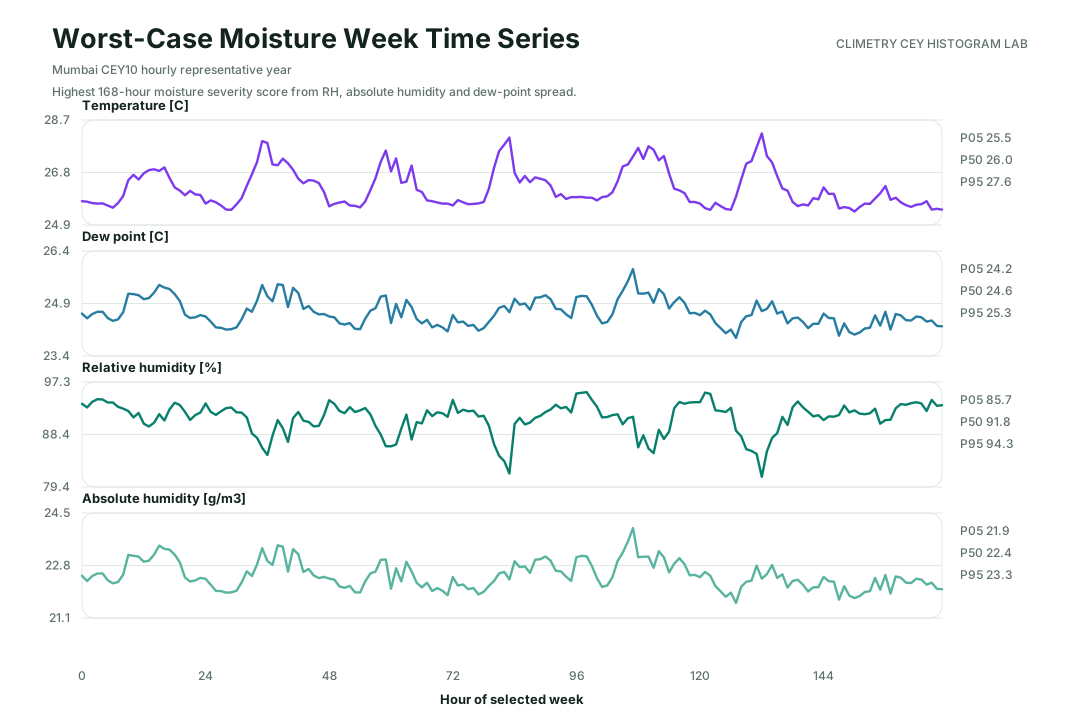
Mumbai Representative moisture-risk week

Representative moisture-risk week

The selected high-risk week highlights periods with elevated humidity, absolute humidity and small dew-point spread. It is a screening view for condensation and moisture-ingress relevance.

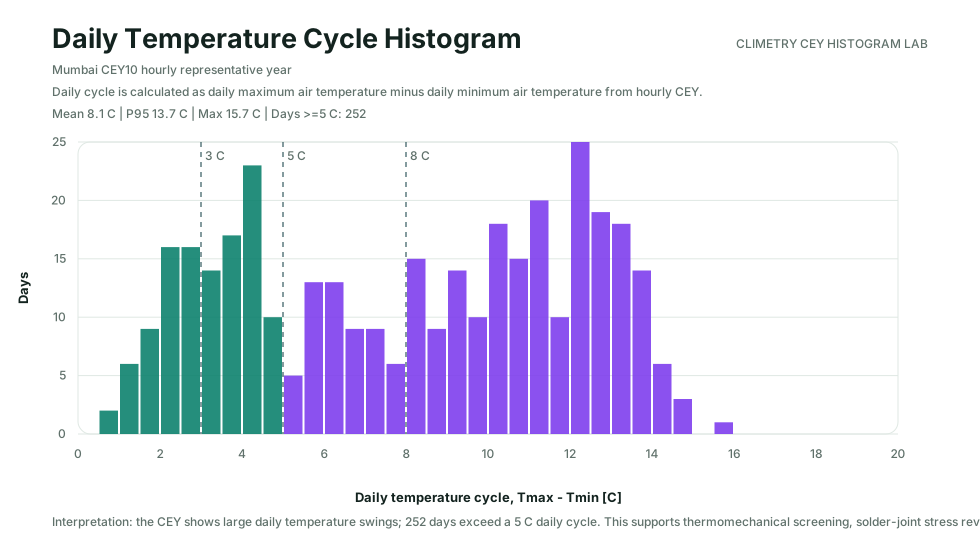
Mumbai Daily temperature cycle histogram

Daily temperature cycle histogram

Daily temperature-cycle statistics provide engineering input for thermomechanical reliability assessments, enclosure breathing and gasket stress screening.

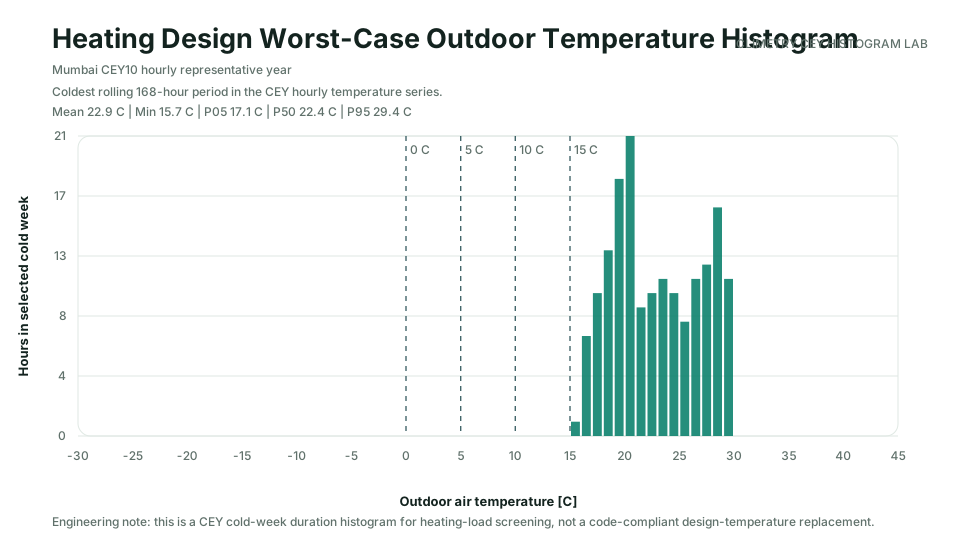
Mumbai Heating-design cold-week histogram

Heating-design cold-week histogram

The cold-week temperature histogram is useful for heating-load screening in temperate and cold climates. In tropical climates it confirms low heating-design relevance.

Definitions

Terms used on this page.

CE class

A Climetry Exposure Class is a location-based environmental severity class for durability screening.

CE classes summarize humidity, condensation potential, marine influence, pollution context and thermal exposure. They are not ISO 9223 corrosivity classes.

RH80 exposure

RH80 exposure is the number of hours where relative humidity is at least 80%.

It is useful for identifying persistent moisture exposure relevant to electronics, coatings, connectors, enclosures and atmospheric corrosion screening.

Condensation potential

Condensation potential indicates conditions where surface wetting risk is elevated.

It is derived from temperature, dew point and humidity context. It is a screening indicator, not a measurement on a specific product surface.

CAMS atmospheric aggressiveness

Pollution and chloride modifiers for corrosion screening.

CAMS monthly atmospheric composition is translated into transparent screening ratings for marine aerosol, pollution, chloride proxy, and regional SO2 background context.

Marine AerosolModerate

Annual CAMS marine score is moderate, with severe monsoon-season peaks.

Pollution ModifierSevere

Urban aerosol and regional sulphur context add strongly to wet-hour corrosion exposure.

Chloride ProxyS1

ISO-style chloride input proxy is elevated and seasonally reinforced.

SO2 BackgroundP3

CAMS indicates severe regional sulphur background; local sources may differ strongly.

CAMS BasisMonthly

Monsoon seasonality is visible in marine and pollution modifiers.

Corrosion DriverMarine monsoon

Humidity, chloride, and pollution combine into severe exposure.

Monthly atmospheric profile

Mumbai CAMS modifiers by month.

Preview profiles show monthly screening envelopes for CAMS-derived marine aerosol, regional SO2 background, particulate pollution, combined pollution, and chloride proxy indicators.

Marine aerosol

36 /100 annual mean

Marine aerosol becomes severe during monsoon-influenced months.

0 /10054 /100108 /100JanFebMarAprMayJunJulAugSepOctNovDec
Min-max P10-P90 Mean
Regional SO2 background

90 /100 annual mean

Regional SO2 background is severe outside the wettest season in CAMS and remains relevant as context.

43 /10074 /100104 /100JanFebMarAprMayJunJulAugSepOctNovDec
Min-max P10-P90 Mean
PM2.5 exposure

92 /100 annual mean

PM2.5 is severe outside the wettest months and contributes to pollution context.

52 /10078 /100104 /100JanFebMarAprMayJunJulAugSepOctNovDec
Min-max P10-P90 Mean
Pollution modifier

92 /100 annual mean

Combined pollution modifier is severe for much of the year.

51 /10077 /100104 /100JanFebMarAprMayJunJulAugSepOctNovDec
Min-max P10-P90 Mean
Chloride proxy

49.250 mg/m2/day annual mean

Chloride proxy rises in monsoon months, reinforcing marine corrosion screening.

19.760 mg/m2/day65.000 mg/m2/day110.240 mg/m2/dayJanFebMarAprMayJunJulAugSepOctNovDec
Min-max P10-P90 Mean
Environmental Data Confidence

ERA5 climate data show consistent long-term environmental agreement.

The environmental indicators presented on this page are derived from ERA5 climate data.

ERA5 thermodynamic variables have been compared against long-term airport weather station observations across multiple climate regions.

The comparison demonstrates good agreement between ERA5 and measured environmental conditions.

TemperatureRMSE 1.15 °C
Dew pointRMSE 1.20 °C
Relative humidityRMSE 5.48 %-points

These comparisons evaluate long-term environmental representativeness and not individual weather events.

Local Station Consistency

Mumbai: ERA5 vs Weather Station Observations

Monthly thermodynamic comparison against Mumbai Santacruz Airport (VABB) weather observations for 2025.

TemperatureRMSE 1.35 C
Dew pointRMSE 2.82 C
Relative humidityRMSE 13.16 %-points
Meteostat monthly valuesERA5 monthly values
City-specific comparison against Mumbai Santacruz Airport (VABB). The chart is schematic; the RMSE values above are calculated from monthly station-versus-ERA5 2025 data.Read methodology
Report preview

Mumbai exposure report structure.

The full report combines climate classification, corrosion screening, condensation exposure, RH80/RH90 hours, marine context, monthly profiles, and reliability implications.

Climate ClassificationHumid Tropical CoastalClimate zone
Climetry Exposure Class (CE)CE-5Environmental severity
Corrosion ScreeningSevereISO-derived indicator
Condensation RiskHighMoisture
RH80 Hours4,091 h/yearWet-hour proxy
RH90 Hours1,733 h/yearExtreme humidity

Reliability implications for Mumbai

High humidity and condensation exposure may result in a severe Climetry Exposure Class even if atmospheric metal corrosivity remains moderate. CE classes indicate environmental severity and qualification relevance, not failure probability.

  • Design assumptions should include severe marine humidity and long wet-hour exposure.
  • Coatings, stainless hardware, sealed connectors, and moisture barriers deserve early attention.
  • Use corrosion and condensation metrics to prioritize qualification and maintenance strategy.
Learn More

Engineering context behind the city exposure pages.

Interactive assessment

Understand your own environmental exposure.

Analyze any location worldwide and compare humidity, condensation and environmental severity.

FAQ

Frequently asked questions

What does CE-5 mean for Mumbai?

CE-5 is a Climetry Exposure Class. It describes overall environmental severity for durability screening and qualification support at this location.

Is this a corrosion prediction?

No. The page provides environmental exposure screening. Corrosion indicators are engineering screening outputs, not failure probability and not a product-specific lifetime prediction.

How reliable are the climate data?

The indicators are derived from ERA5 climate data. ERA5 thermodynamic variables have been compared against representative airport weather observations and show good monthly agreement for temperature, dew point and relative humidity.

What is the difference between CE class and ISO corrosivity?

CE classes describe overall environmental severity. ISO 9223 corrosivity classes describe material-related atmospheric corrosivity categories. They are related but not equivalent.

How does Climetry use ERA5?

Climetry uses ERA5 temperature, dew point and pressure fields to derive relative humidity, absolute humidity and environmental exposure indicators for engineering interpretation.