United States climate exposure

San Francisco Climate Exposure: Marine Chloride and Cool-Humid Corrosion Context

San Francisco is a cool marine deployment environment where corrosion relevance is driven more by chloride and persistent humidity than by heat.

Analyze San Francisco
Climate exposure summary
CE-4Cool Marine Exposure
  • Strong marine chloride exposure
  • Persistent humidity and fog context
  • Low thermal stress

Marine chloride is the primary stressor. Persistent humidity is the secondary driver for reliability and field durability decisions.

CE classes describe overall environmental severity and are not equivalent to ISO corrosivity classes.

Dominant mechanismsMarine chlorideCool-humid wetnessLow heat / low freeze
Cool Mediterranean MarineModerate to high humidityStrong coastal marine exposure
San Francisco37.775, -122.419
Engineering Climate Fingerprintâ„¢

San Francisco environmental load barcode.

A normalized 0-100 matrix showing which exposure mechanisms dominate the deployment environment. Scores describe environmental load intensity, not failure probability.

ECF patternPrimary: Marine · Secondary: Humidity
Humidity58Moderate
Condensation52Moderate
Thermal18Low
Marine86Severe
Pollution34Low
Freeze2Minimal
Humidity: Persistent marine humidity and fog contextCondensation: Marine-layer dew-point margin and cool wetnessThermal: Low heat stress and mild seasonal temperature rangeMarine: Calibrated California chloride layer at San Francisco: 209 mg/m2/dayPollution: California SOx transport screening index at San Francisco: 27/80Freeze: Rare frost exposure
Typical Applications

Equipment categories where this climate profile is relevant.

Outdoor ElectronicsTelecom EquipmentEV ChargingCoastal InfrastructurePower ElectronicsTransport Electronics
Why this climate matters

Why San Francisco climate matters

San Francisco demonstrates that corrosion exposure can be relevant even where heat stress is relatively low.

Marine chloride, fog-prone humidity and limited drying potential can affect exposed metals, connectors, fasteners and enclosure interfaces.

For qualification planning, San Francisco is a useful contrast case to hot-humid cities such as Houston or Singapore because the dominant mechanism is coastal marine exposure rather than temperature.
Engineering metrics

Exposure metrics that matter before deployment.

Climetry-derived indicators summarize environmental severity. ISO-derived indicators estimate material-related atmospheric corrosivity for metals such as carbon steel, zinc, copper and aluminum.

Climate Exposure SummaryCool marine exposure

Low heat stress with strong coastal chloride and persistent humidity.

Corrosion RiskHigh

Calibrated California chloride layer indicates strong marine deposition context.

Condensation RiskModerate

Fog-prone and cool-humid periods can support surface wetness.

RH80 Hours3,628 h/year

CEY10 frequent high-humidity exposure without tropical heat.

RH90 Hours1,606 h/year

CEY10 extreme RH periods occur during fog and cool wet episodes.

Climate ClassificationCool Mediterranean Marine

Coastal, mild, low heat, strong marine modifier.

Monthly climate profile

San Francisco thermodynamic exposure by month.

Preview profiles show monthly min-max envelopes, P10-P90 percentile bands, and monthly means for the core thermodynamic variables.

Relative humidity

75 % annual mean

Humidity is persistent despite mild temperatures, especially during fog-prone periods.

51 %75 %99 %JanFebMarAprMayJunJulAugSepOctNovDec
Min-max P10-P90 Mean
Air temperature

14.2 C annual mean

Thermal stress is low; the climate is dominated by cool marine exposure rather than heat.

1.0 C14.0 C27.0 CJanFebMarAprMayJunJulAugSepOctNovDec
Min-max P10-P90 Mean
Absolute humidity

9.1 g/m3 annual mean

Absolute humidity is moderate but drying potential can remain limited near the coast.

1.6 g/m39.1 g/m316.6 g/m3JanFebMarAprMayJunJulAugSepOctNovDec
Min-max P10-P90 Mean
Dew point

9.4 C annual mean

Dew point and air temperature can remain close during fog and marine-layer conditions.

-0.7 C9.4 C19.4 CJanFebMarAprMayJunJulAugSepOctNovDec
Min-max P10-P90 Mean
Hourly CEY engineering statistics

San Francisco representative-year diagrams.

These figures are calculated from the local hourly Climetry Environmental Year and translate thermodynamic climate data into engineering-readable duration, cycle and moisture-risk views.

San Francisco CEY10 temperature duration

CEY10 temperature duration

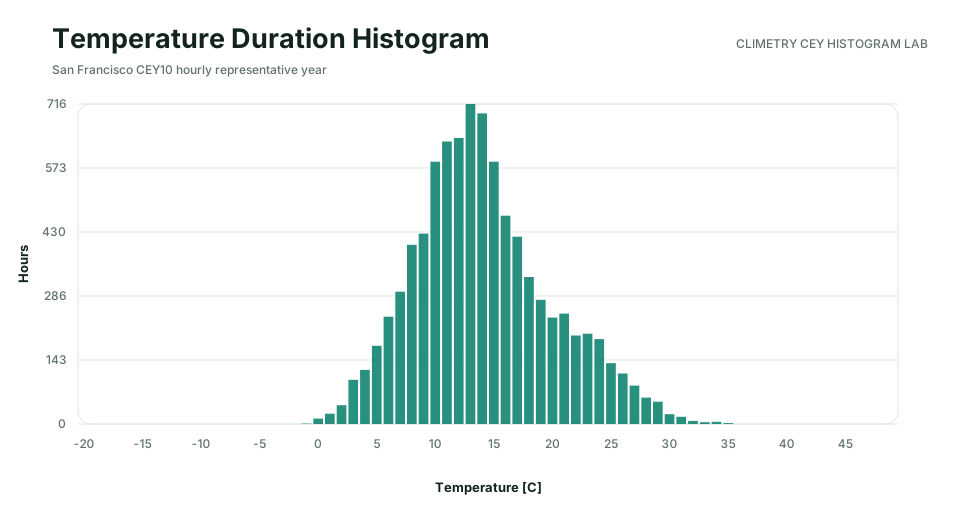
San Francisco's 1 C temperature-duration histogram is calculated from the selected hourly CEY10 source months. It shows how long products experience each outdoor temperature band during the representative year.

San Francisco CEY10 relative humidity duration

CEY10 relative humidity duration

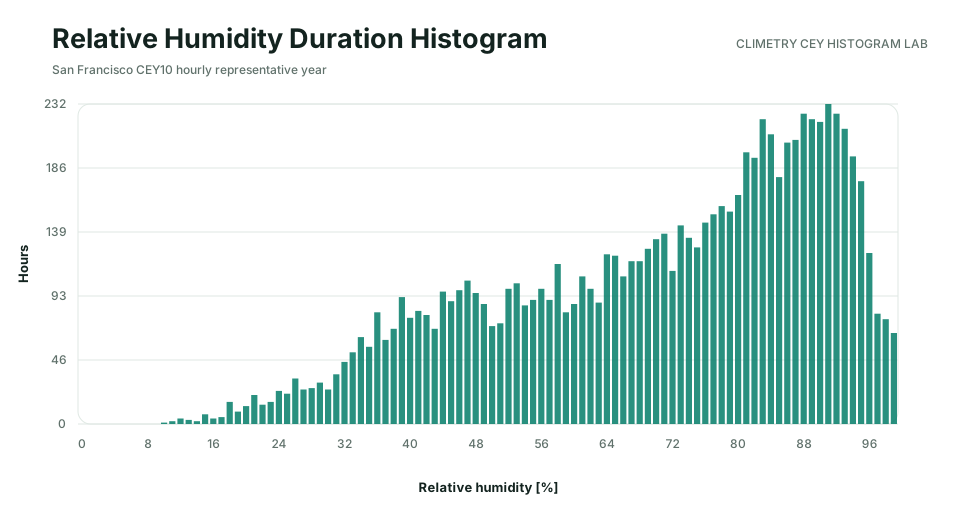
The RH duration histogram translates relative humidity into annual exposure hours. It supports moisture-sensitive electronics, coating, connector and enclosure screening.

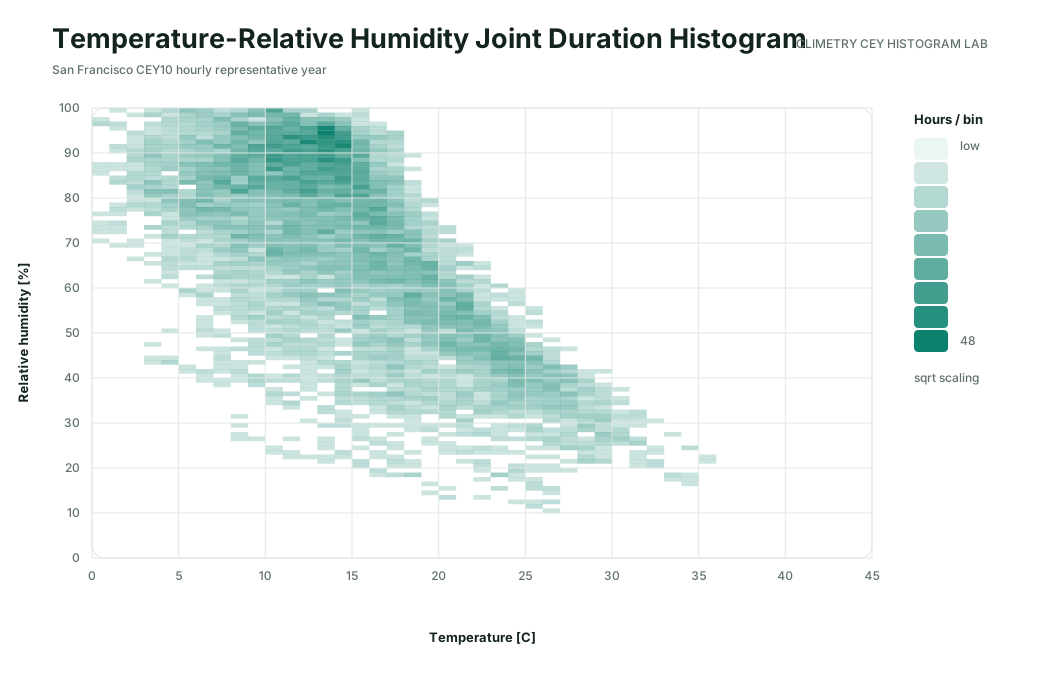
San Francisco Temperature x RH occurrence

Temperature x RH occurrence

The joint duration heatmap shows which temperature and humidity combinations occur together. This is more useful for durability screening than separate annual averages.

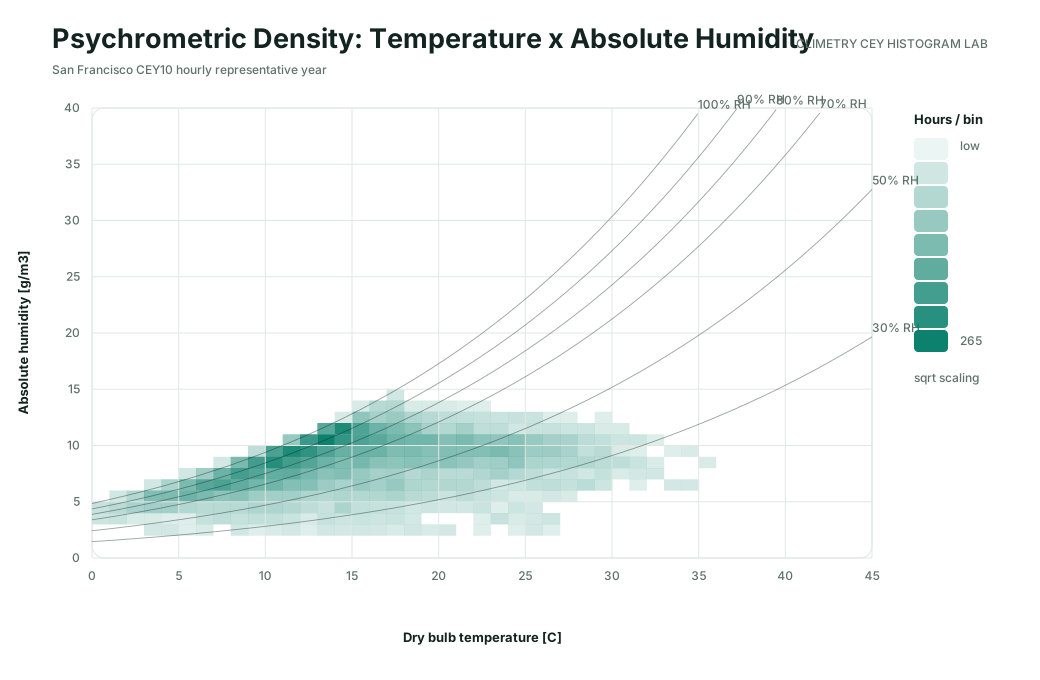
San Francisco Psychrometric moisture density

Psychrometric moisture density

The psychrometric density view connects dry-bulb temperature with absolute humidity and helps identify moisture-rich operating conditions and drying limitations.

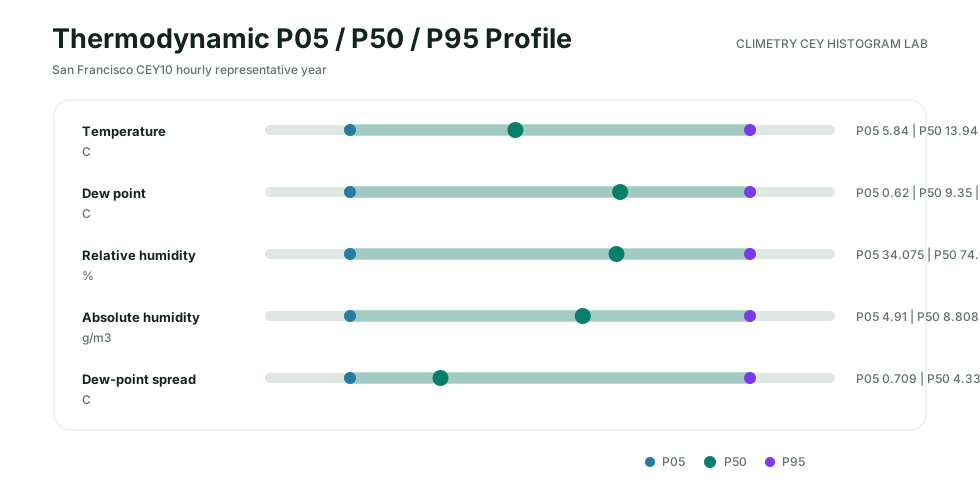
San Francisco P05 / P50 / P95 thermodynamic profile

P05 / P50 / P95 thermodynamic profile

The percentile profile summarizes the representative spread of temperature, dew point, relative humidity, absolute humidity and dew-point margin.

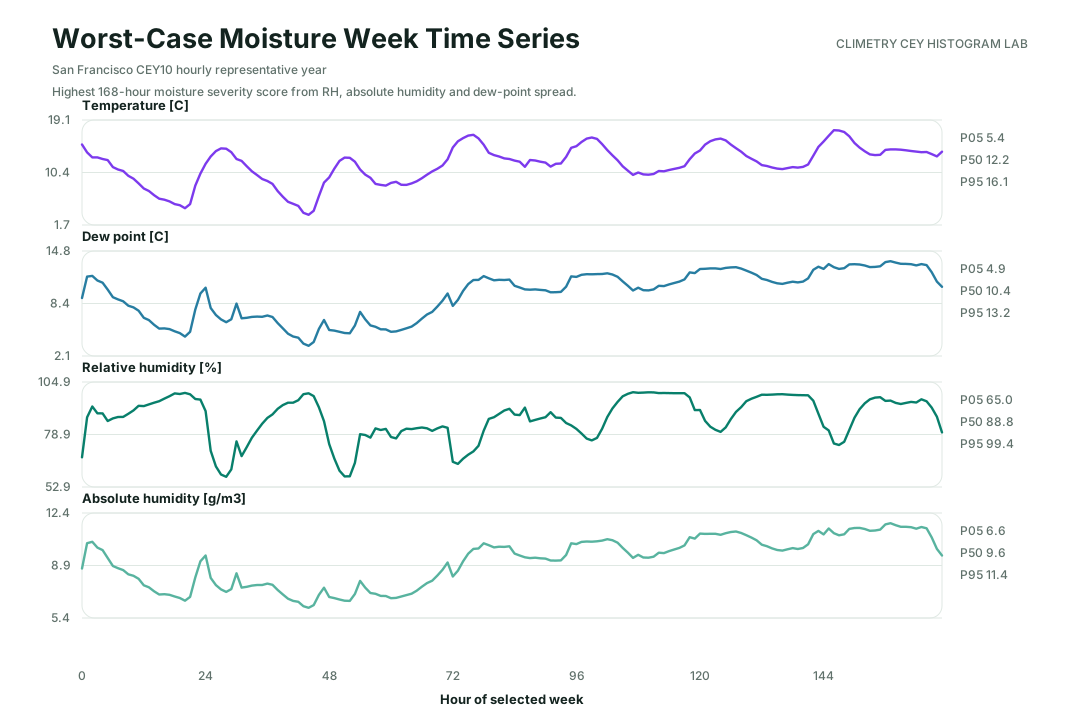
San Francisco Representative moisture-risk week

Representative moisture-risk week

The selected high-risk week highlights periods with elevated humidity, absolute humidity and small dew-point spread. It is a screening view for condensation and moisture-ingress relevance.

San Francisco Daily temperature cycle histogram

Daily temperature cycle histogram

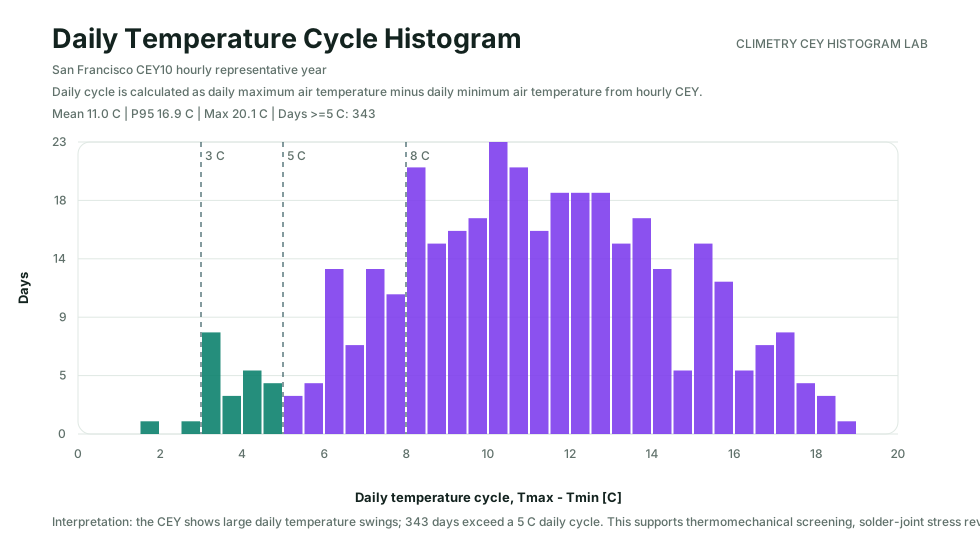
Daily temperature-cycle statistics provide engineering input for thermomechanical reliability assessments, enclosure breathing and gasket stress screening.

San Francisco Heating-design cold-week histogram

Heating-design cold-week histogram

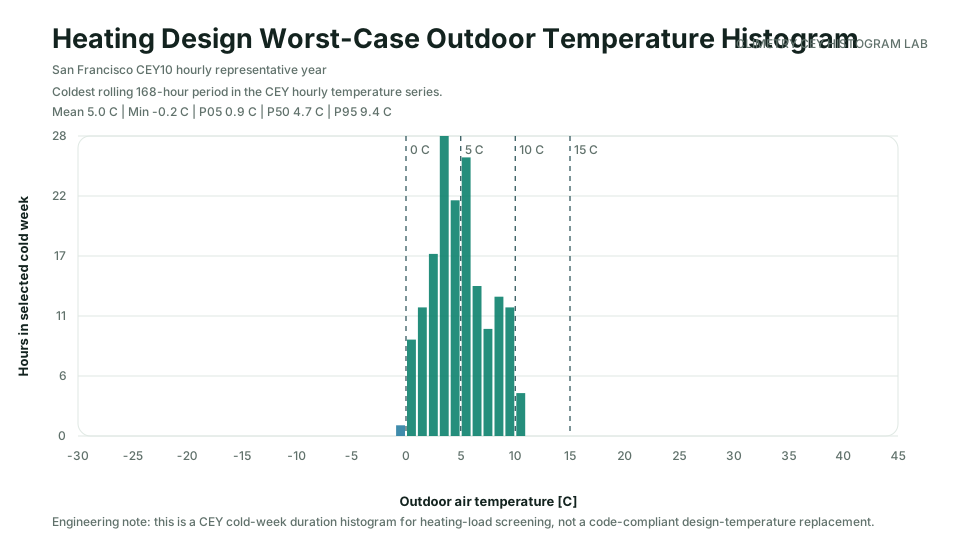
The cold-week temperature histogram is useful for heating-load screening in temperate and cold climates. In tropical climates it confirms low heating-design relevance.

Definitions

Terms used on this page.

CE class

A Climetry Exposure Class is a location-based environmental severity class for durability screening.

CE classes summarize humidity, condensation potential, marine influence, pollution context and thermal exposure. They are not ISO 9223 corrosivity classes.

RH80 exposure

RH80 exposure is the number of hours where relative humidity is at least 80%.

It is useful for identifying persistent moisture exposure relevant to electronics, coatings, connectors, enclosures and atmospheric corrosion screening.

Condensation potential

Condensation potential indicates conditions where surface wetting risk is elevated.

It is derived from temperature, dew point and humidity context. It is a screening indicator, not a measurement on a specific product surface.

Atmospheric transport screening

California 1.5 km chloride and SOx context with ISO-derived corrosivity screening.

San Francisco values are sampled from the updated Climetry California 1.5 km atmospheric transport overlays using 32 wind sectors and corrected diffusion. Chloride is calibrated against regional NADP stations; SOx is rank-valid but magnitude-uncalibrated. ISO-derived corrosivity values are engineering screening estimates for carbon steel, zinc, copper and aluminum, not certified ISO 9223 classifications.

Annual Grid-Cell Chloride209 mg/m2/day

Annual mean sampled at San Francisco from the California 1.5 km atmospheric transport grid with 32 wind sectors.

Chloride StatusCalibrated

California chloride calibration: R2=0.409, rho=0.691, n=11 against NADP wet-deposition stations.

Distance to Coast2.2 km

Immediate marine exposure is the dominant atmospheric modifier.

SOx Exposure27 / 80

Sampled at San Francisco from the California SOx transport screening grid with 32 wind sectors.

SOx ValidationRank-valid

EPA SO2 comparison: rho=0.513, p=0.0023, n=33. Absolute magnitude remains uncalibrated.

ISO Input ClassesT3 / S2 / P1

Approximate ISO 9223-style input categories: time of wetness, chloride deposition and sulphur pollution screening input.

Carbon SteelC2

ISO-derived screening estimate: about 10.0 um/year using California 32-sector chloride and SOx context.

ZincC2

ISO-derived screening estimate: about 0.426 um/year; marine chloride is the main driver.

CopperC2

ISO-derived screening estimate: about 0.206 um/year; screening-level atmospheric corrosivity, not certified site classification.

AluminumC2

ISO-derived screening estimate: about 0.322 um/year; chloride-sensitive but below severe coastal-tropical levels.

Corrosion DriverMarine chloride

For San Francisco, marine chloride and cool-humid wetness dominate over heat or SOx.

Monthly atmospheric transport profile

San Francisco chloride and SOx screening by month.

Monthly profiles are derived from the California 2015-2024 atmospheric transport model at the San Francisco grid cell. The layer uses 32-sector ERA5 wind climatology, a 1.5 km target grid and corrected diffusion.

Chloride deposition

209.300 mg/m2/day annual mean

Monthly chloride screening estimates are normalized to the same annual grid-cell mean shown above. The calibrated California layer indicates strong marine chloride exposure at San Francisco, with winter and shoulder-season peaks in the screening profile.

0.000 mg/m2/day275.798 mg/m2/day551.596 mg/m2/dayJanFebMarAprMayJunJulAugSepOctNovDec
Min-max P10-P90 Mean
SOx exposure

26.9 /80 annual mean

The SOx screening index is lower than chloride exposure. Rank validity is meaningful at regional scale, but absolute magnitude is not calibrated.

0.0 /8039.1 /8078.3 /80JanFebMarAprMayJunJulAugSepOctNovDec
Min-max P10-P90 Mean
Environmental Data Confidence

ERA5 climate data show consistent long-term environmental agreement.

The environmental indicators presented on this page are derived from ERA5 climate data.

ERA5 thermodynamic variables have been compared against long-term airport weather station observations across multiple climate regions.

The comparison demonstrates good agreement between ERA5 and measured environmental conditions.

TemperatureRMSE 1.15 °C
Dew pointRMSE 1.20 °C
Relative humidityRMSE 5.48 %-points

These comparisons evaluate long-term environmental representativeness and not individual weather events.

Local Station Consistency

San Francisco: ERA5 vs Weather Station Observations

Monthly thermodynamic comparison against San Francisco International Airport (KSFO) weather observations for 2025.

TemperatureRepresentative coastal profile
Dew pointMarine-layer context
Relative humidityScreening comparison pending
Meteostat monthly valuesERA5 monthly values
City-specific comparison against San Francisco International Airport (KSFO). The chart is schematic; the RMSE values above are calculated from monthly station-versus-ERA5 2025 data.Read methodology
Report preview

San Francisco exposure report structure.

The full report combines climate classification, corrosion screening, condensation exposure, RH80/RH90 hours, marine context, monthly profiles, and reliability implications.

Climate ClassificationCool Mediterranean MarineClimate zone
Climetry Exposure Class (CE)CE-4Environmental severity
Corrosion ScreeningHighISO-derived indicator
Condensation RiskModerateMoisture
RH80 Hours3,628 h/yearWet-hour proxy
RH90 Hours1,606 h/yearExtreme humidity

Reliability implications for San Francisco

High humidity and condensation exposure may result in a severe Climetry Exposure Class even if atmospheric metal corrosivity remains moderate. CE classes indicate environmental severity and qualification relevance, not failure probability.

  • Treat marine chloride and cool-humid wetness as the dominant durability context.
  • Review coating systems, fasteners, connector sealing and galvanic compatibility for coastal deployments.
  • Use San Francisco as a contrast to hot-humid sites: corrosion relevance can be high even when heat exposure is low.
Learn More

Engineering context behind the city exposure pages.

Interactive assessment

Understand your own environmental exposure.

Analyze any location worldwide and compare humidity, condensation and environmental severity.

FAQ

Frequently asked questions

What does CE-4 mean for San Francisco?

CE-4 is a Climetry Exposure Class. It describes overall environmental severity for durability screening and qualification support at this location.

Is this a corrosion prediction?

No. The page provides environmental exposure screening. Corrosion indicators are engineering screening outputs, not failure probability and not a product-specific lifetime prediction.

How reliable are the climate data?

The indicators are derived from ERA5 climate data. ERA5 thermodynamic variables have been compared against representative airport weather observations and show good monthly agreement for temperature, dew point and relative humidity.

What is the difference between CE class and ISO corrosivity?

CE classes describe overall environmental severity. ISO 9223 corrosivity classes describe material-related atmospheric corrosivity categories. They are related but not equivalent.

How does Climetry use ERA5?

Climetry uses ERA5 temperature, dew point and pressure fields to derive relative humidity, absolute humidity and environmental exposure indicators for engineering interpretation.